Project context
Lava flow hazard maps are built by simulating flows from possible vents, which needs a realistic eruption volume. Published volumes for these flows are often rough, so better elevation data can tighten them.
SP Crater, an exceptionally well-preserved cinder cone and lava flow north of Flagstaff, served as the calibration flow: measure its volume carefully, then use it to tune flow-simulation parameters before running vents across the whole field.
My role
- Processed 2,622 drone photos of the SP Crater flow in Agisoft Metashape into a point cloud and DEM
- Mapped lava flow outlines and vent locations across the volcanic field from a 12 m ALOS PALSAR DEM
- Interpolated pre-eruption surfaces and calculated flow volumes by raster differencing in QGIS
- Computed lava flow volumes for 28 cinder cones as inputs to a probabilistic hazard assessment
Co-author of an EGU General Assembly 2026 presentation on lava flow emplacement and hazard assessment, with a manuscript in preparation.The figures here show my processing of the SP Crater data, which is separate from the manuscript's findings.
3D Model of the SP Crater Lava Flow
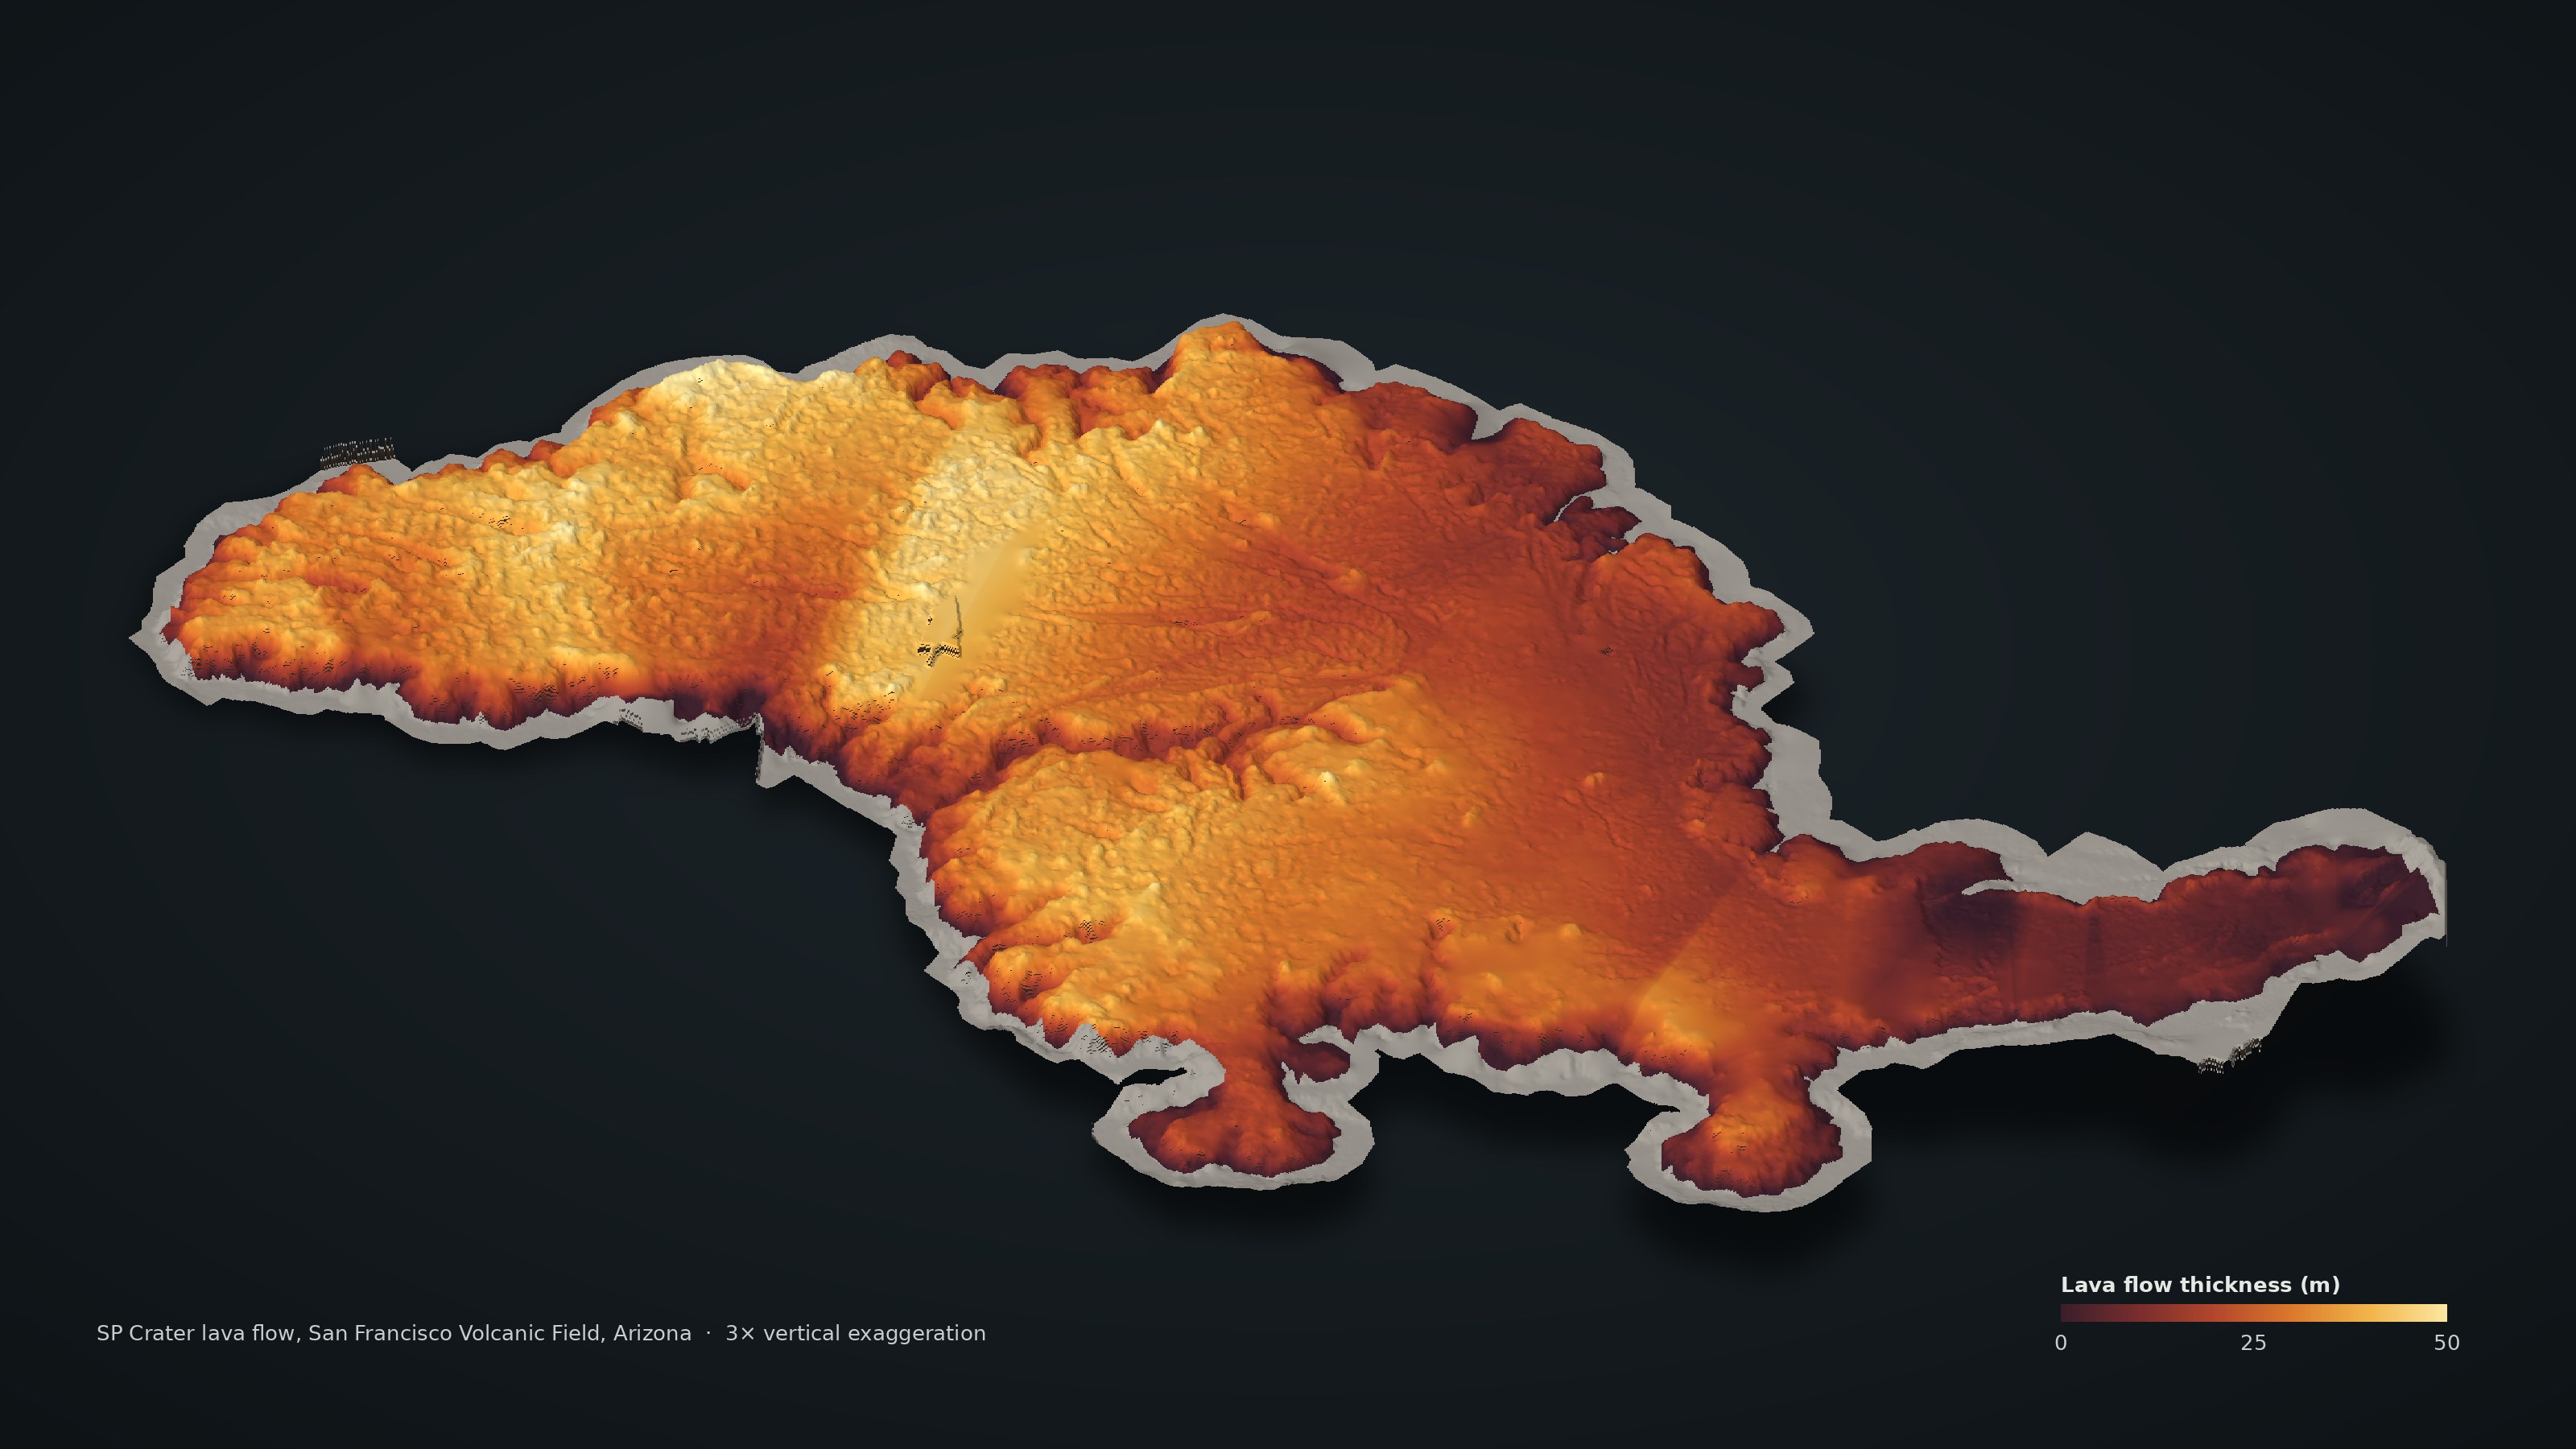
The drone-derived elevation model in 3D, coloured by flow thickness. The thickest lava, over 40 m, sits in the broad central lobe, and the flow thins toward its long narrow tail and outer lobes.
Volume Calculation
How the volume was measured. The surface the lava flowed over is buried, so it was reconstructed by interpolating the terrain just outside the flow margin across the flow. Subtracting that base from today's surface gives thickness at every cell, and summing thickness times cell area gives volume.
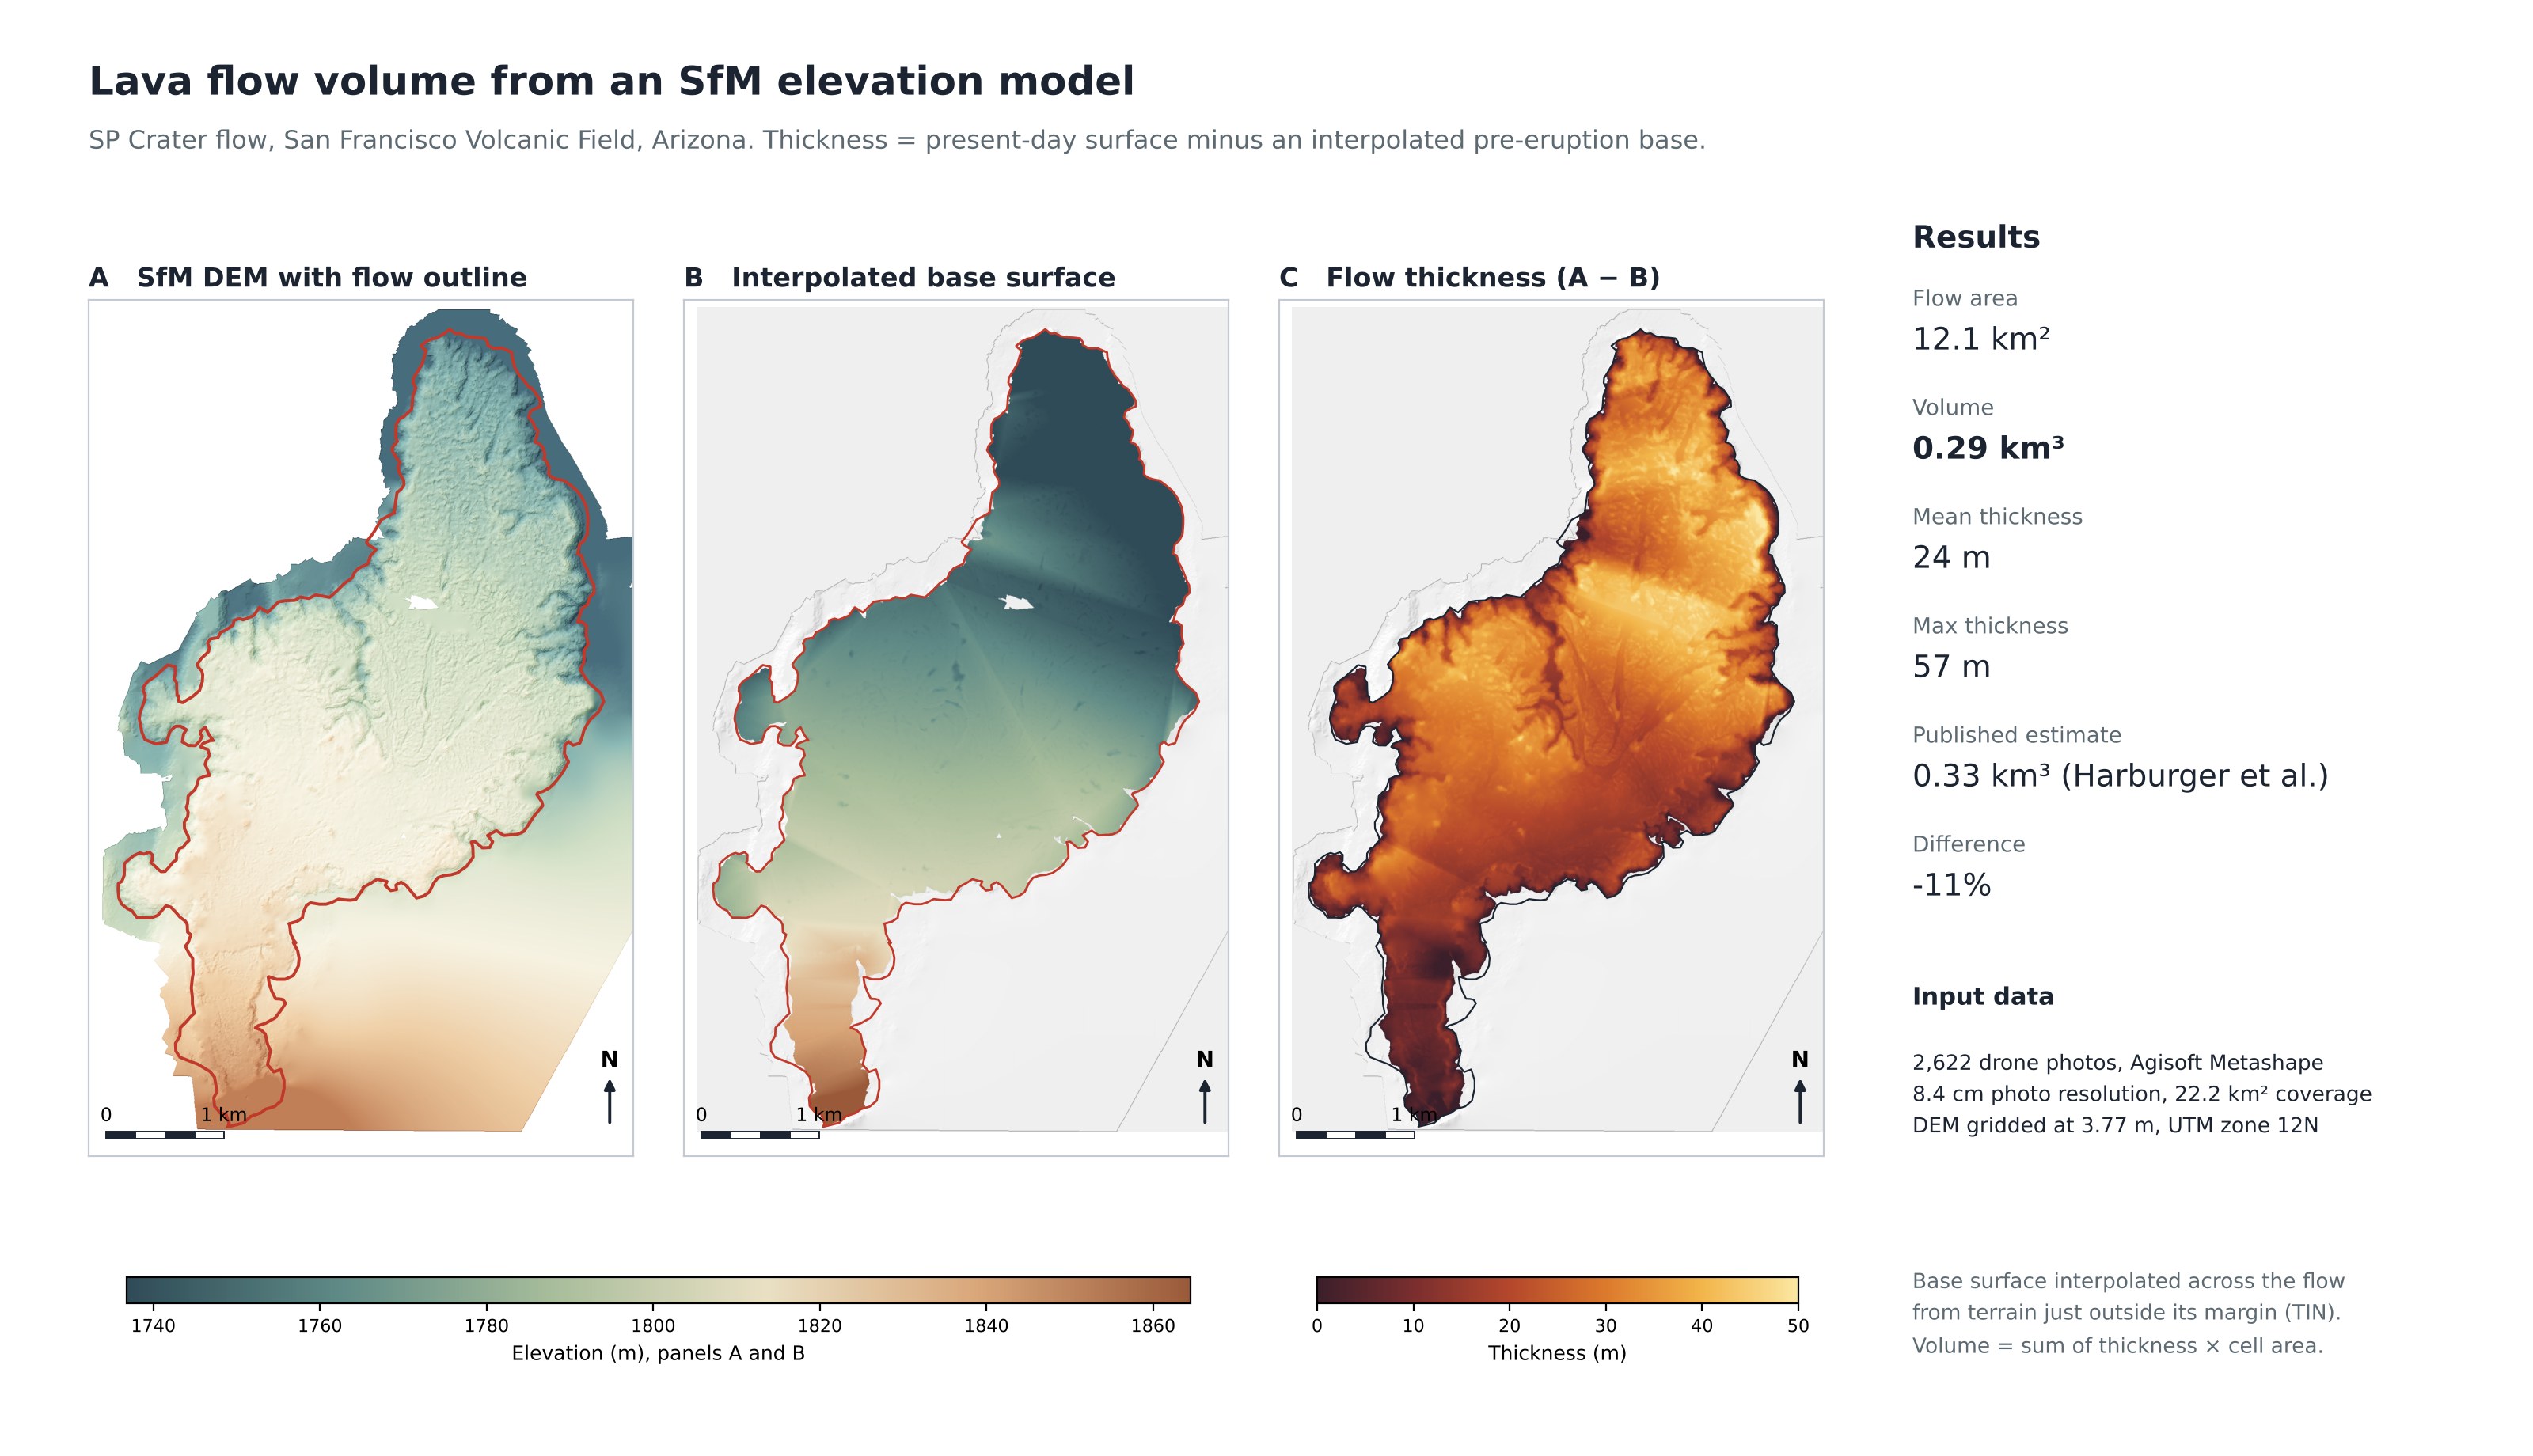
Checking the result: the drone-based volume of 0.29 km³ is within 11% of the published estimate of 0.33 km³ (Harburger et al.). The remaining difference mostly reflects how the buried base surface is reconstructed, which is the largest source of uncertainty in this method.
Flows and Vents Across the Volcanic Field
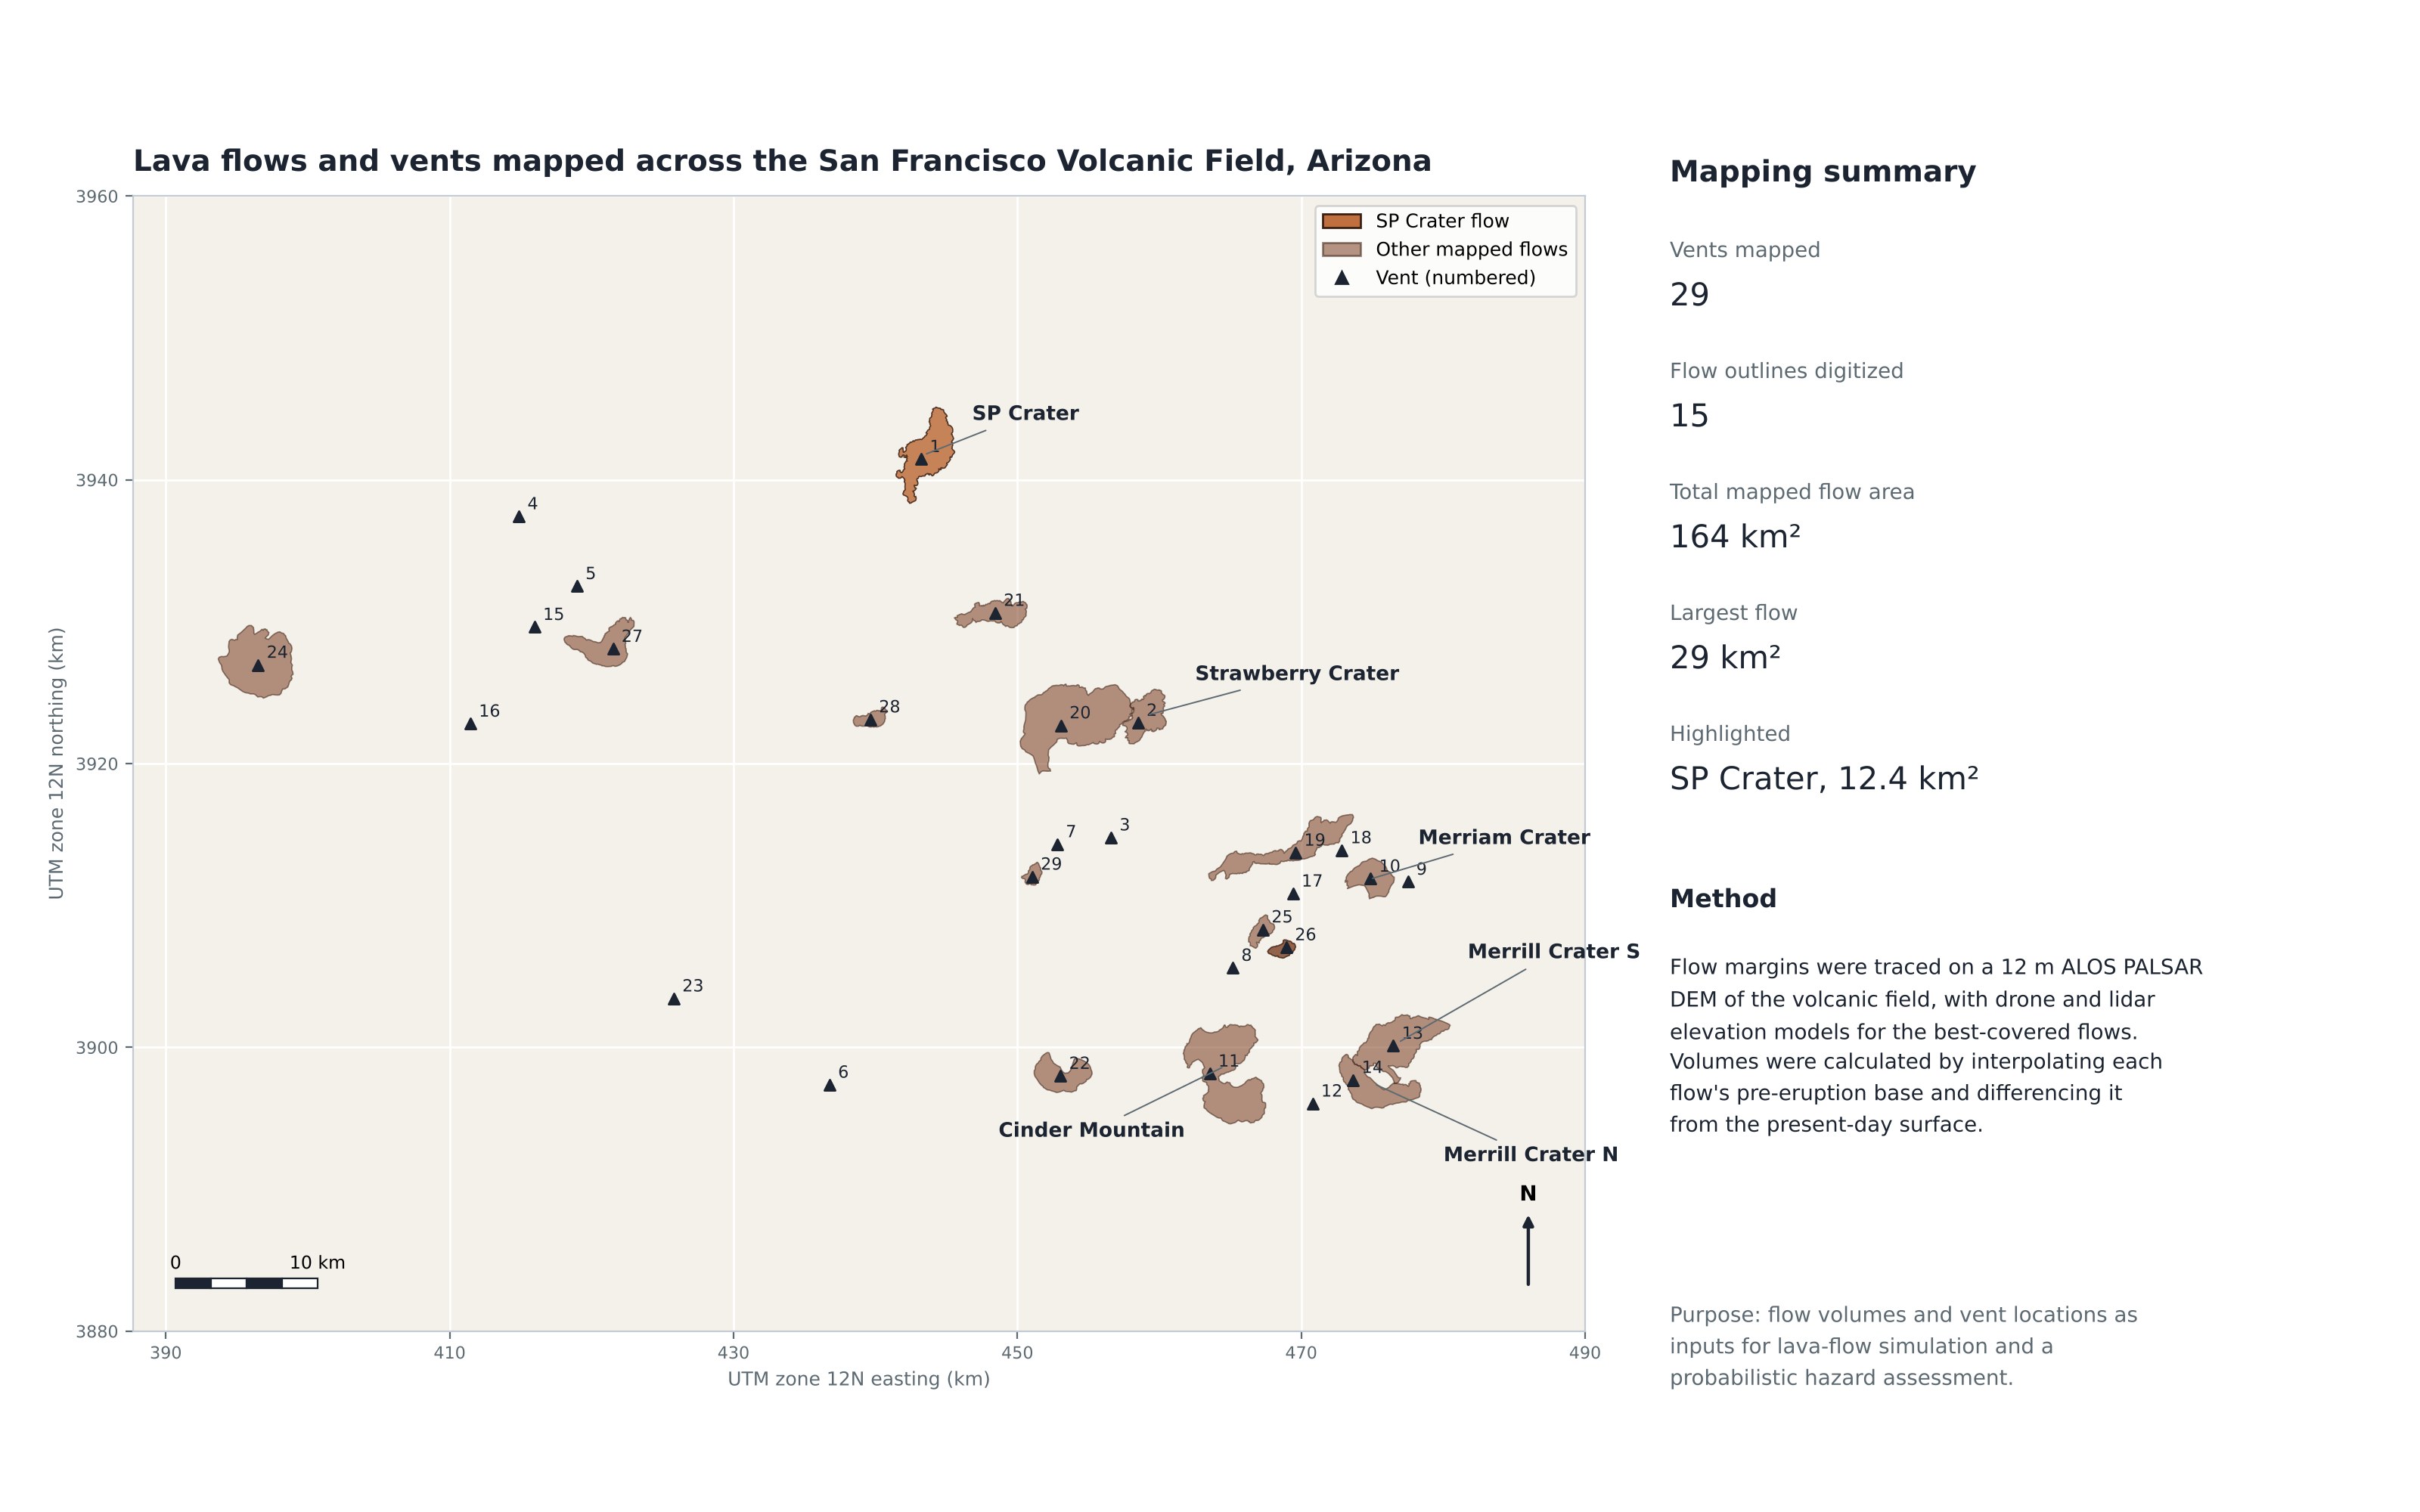
29 vents and 15 lava flow outlines mapped across the San Francisco Volcanic Field, about 164 km² of lava in total. These locations and volumes feed the field-wide flow simulations behind the hazard assessment.
Limitations
The pre-eruption surface under each flow cannot be observed, so every volume depends on how that base is interpolated, especially under the thickest parts of the flow. The drone survey used onboard GNSS without ground control (average camera-position error about 5 m), which mainly affects absolute position rather than thickness. The regional radar DEM is coarser (12 m), so volumes for flows without drone or lidar coverage carry larger uncertainty.