Project context
Nisyros has been active for roughly 100,000 years. Its caldera hosts a cluster of hydrothermal craters, including Stefanos, Polyvotis and Kaminakia, where hot fluids rising from depth heat the ground and release CO2.
Tracking where the ground is hot and where gas escapes, and how that changes between surveys, is one way volcanologists monitor the state of the system. The project combined high-resolution drone mapping with field measurements in 2022 and 2025.
My role
- Took part in both field campaigns, where DJI drone surveys collected georeferenced imagery
- Processed the imagery in Agisoft Metashape into point clouds, DEMs and orthomosaics
- Measured CO2 flux with an accumulation chamber and recorded ground temperatures
- Mapped the field data in QGIS and tested how CO2 flux relates to ground temperature
I am a co-author of Internal and external processes driving heat transfer at volcanic hydrothermal systems, Bulletin of Volcanology (2025), which used the 2022 drone survey.The CO2 and temperature analysis was also presented as a Drexel STAR Scholars research poster.
Drone Orthomosaic
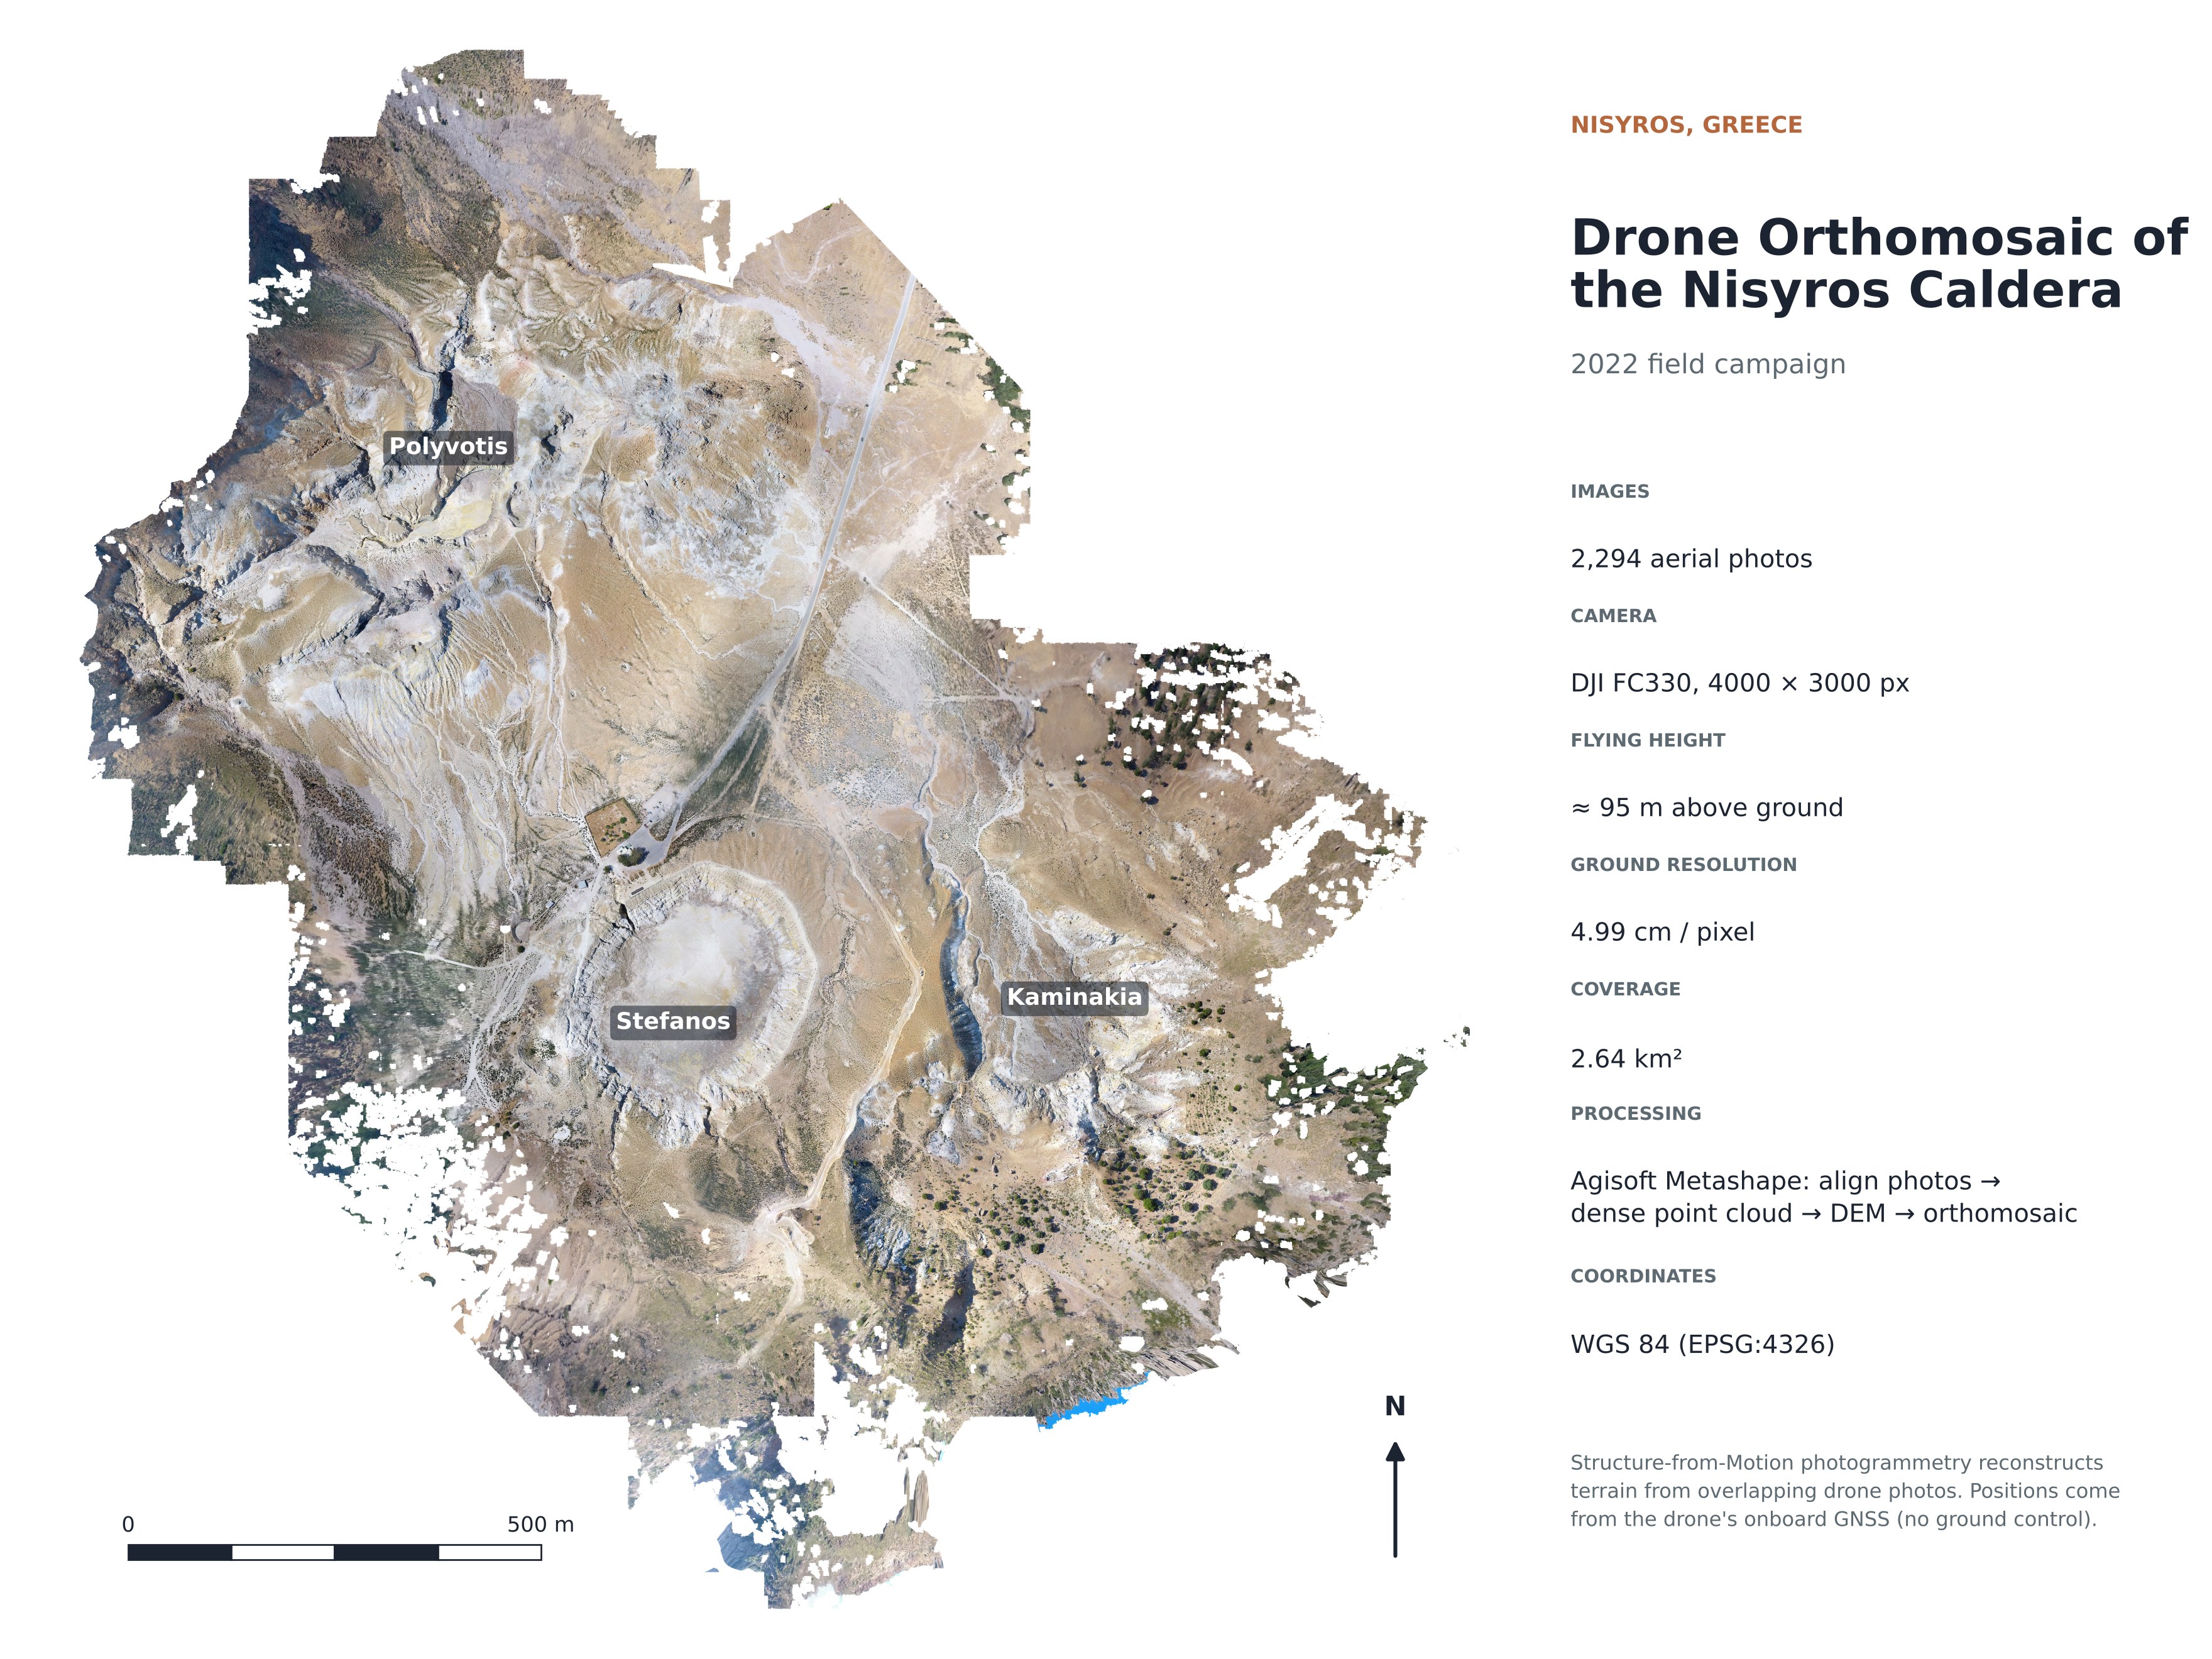
2,294 overlapping drone photos stitched into one map of the caldera floor at 5 cm per pixel. At this resolution, individual vents, footpaths and the altered white ground around Stefanos are all visible.
3D Crater Terrain Model
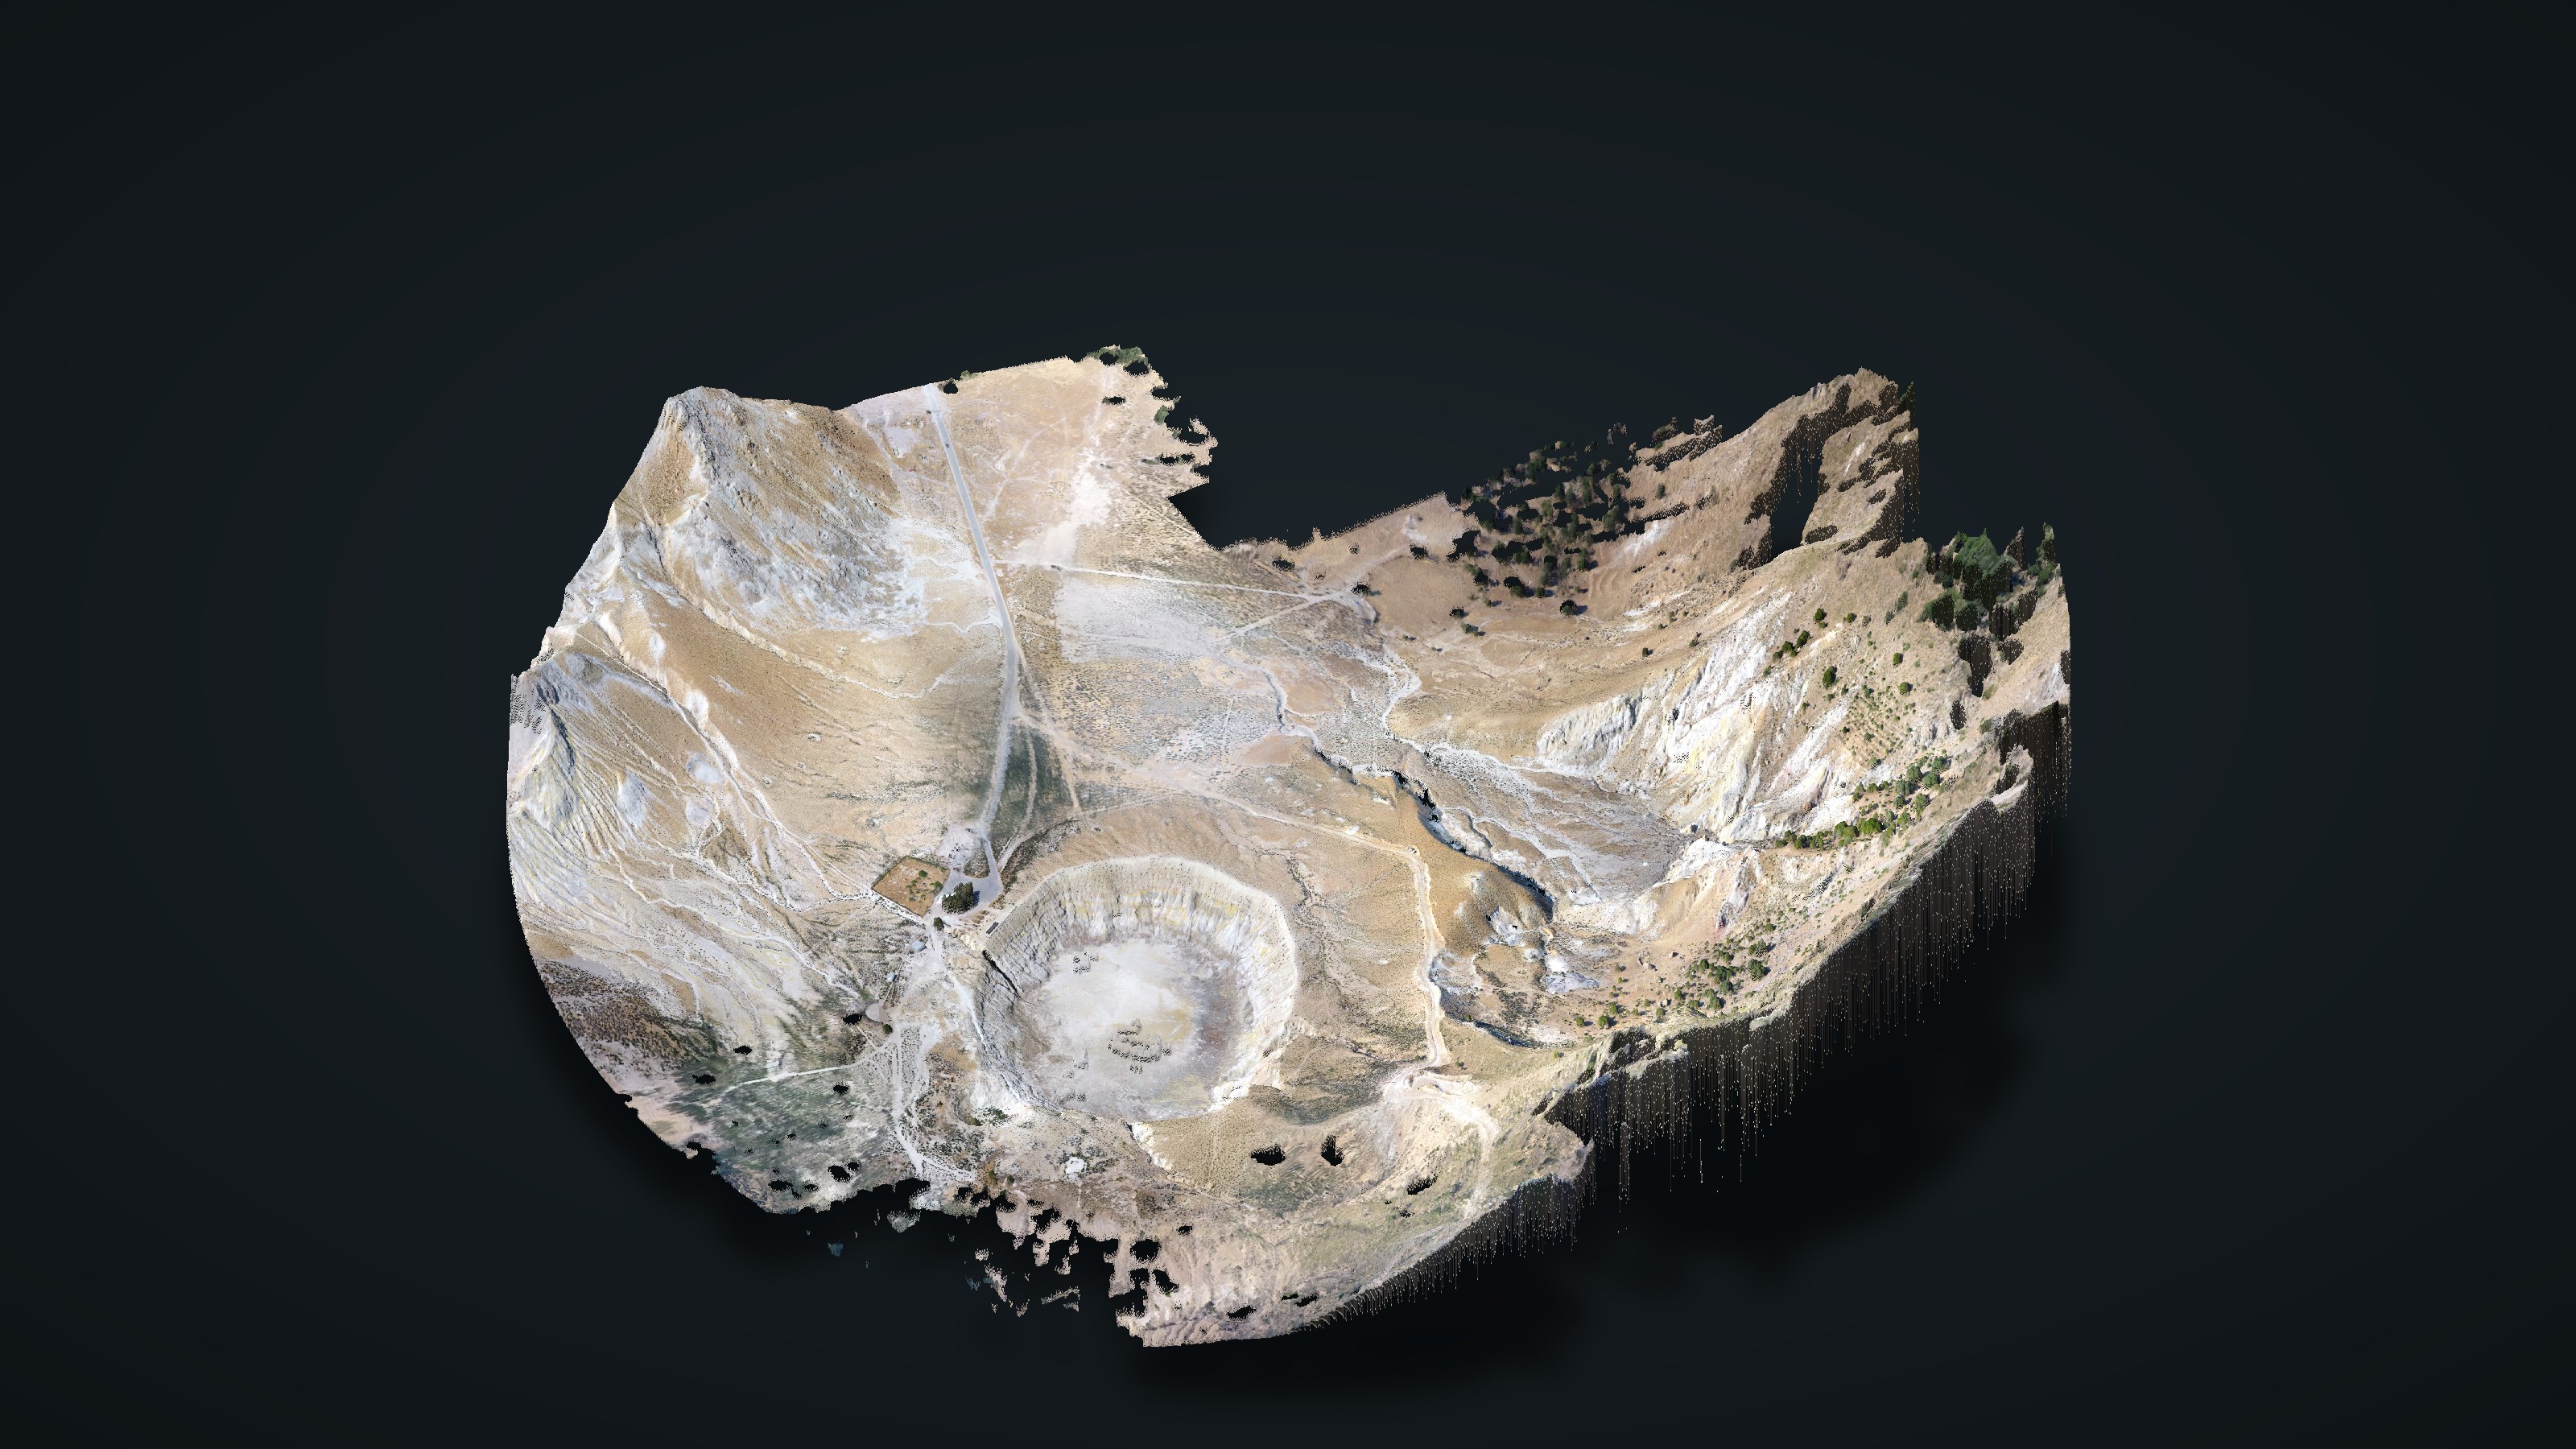
The 10 cm elevation model from the same survey, with the orthomosaic draped over it. Stefanos crater sits in the foreground, with the gullied slopes of Kaminakia to its right.
Hydrothermal Ground Temperature
770 ground-temperature measurements across the three crater areas, plotted on the orthomosaic. Readings reach about 100 °C, the boiling point of water, where steam heats the ground. They form rings around the Stefanos crater floor and dense hot clusters at Polyvotis.
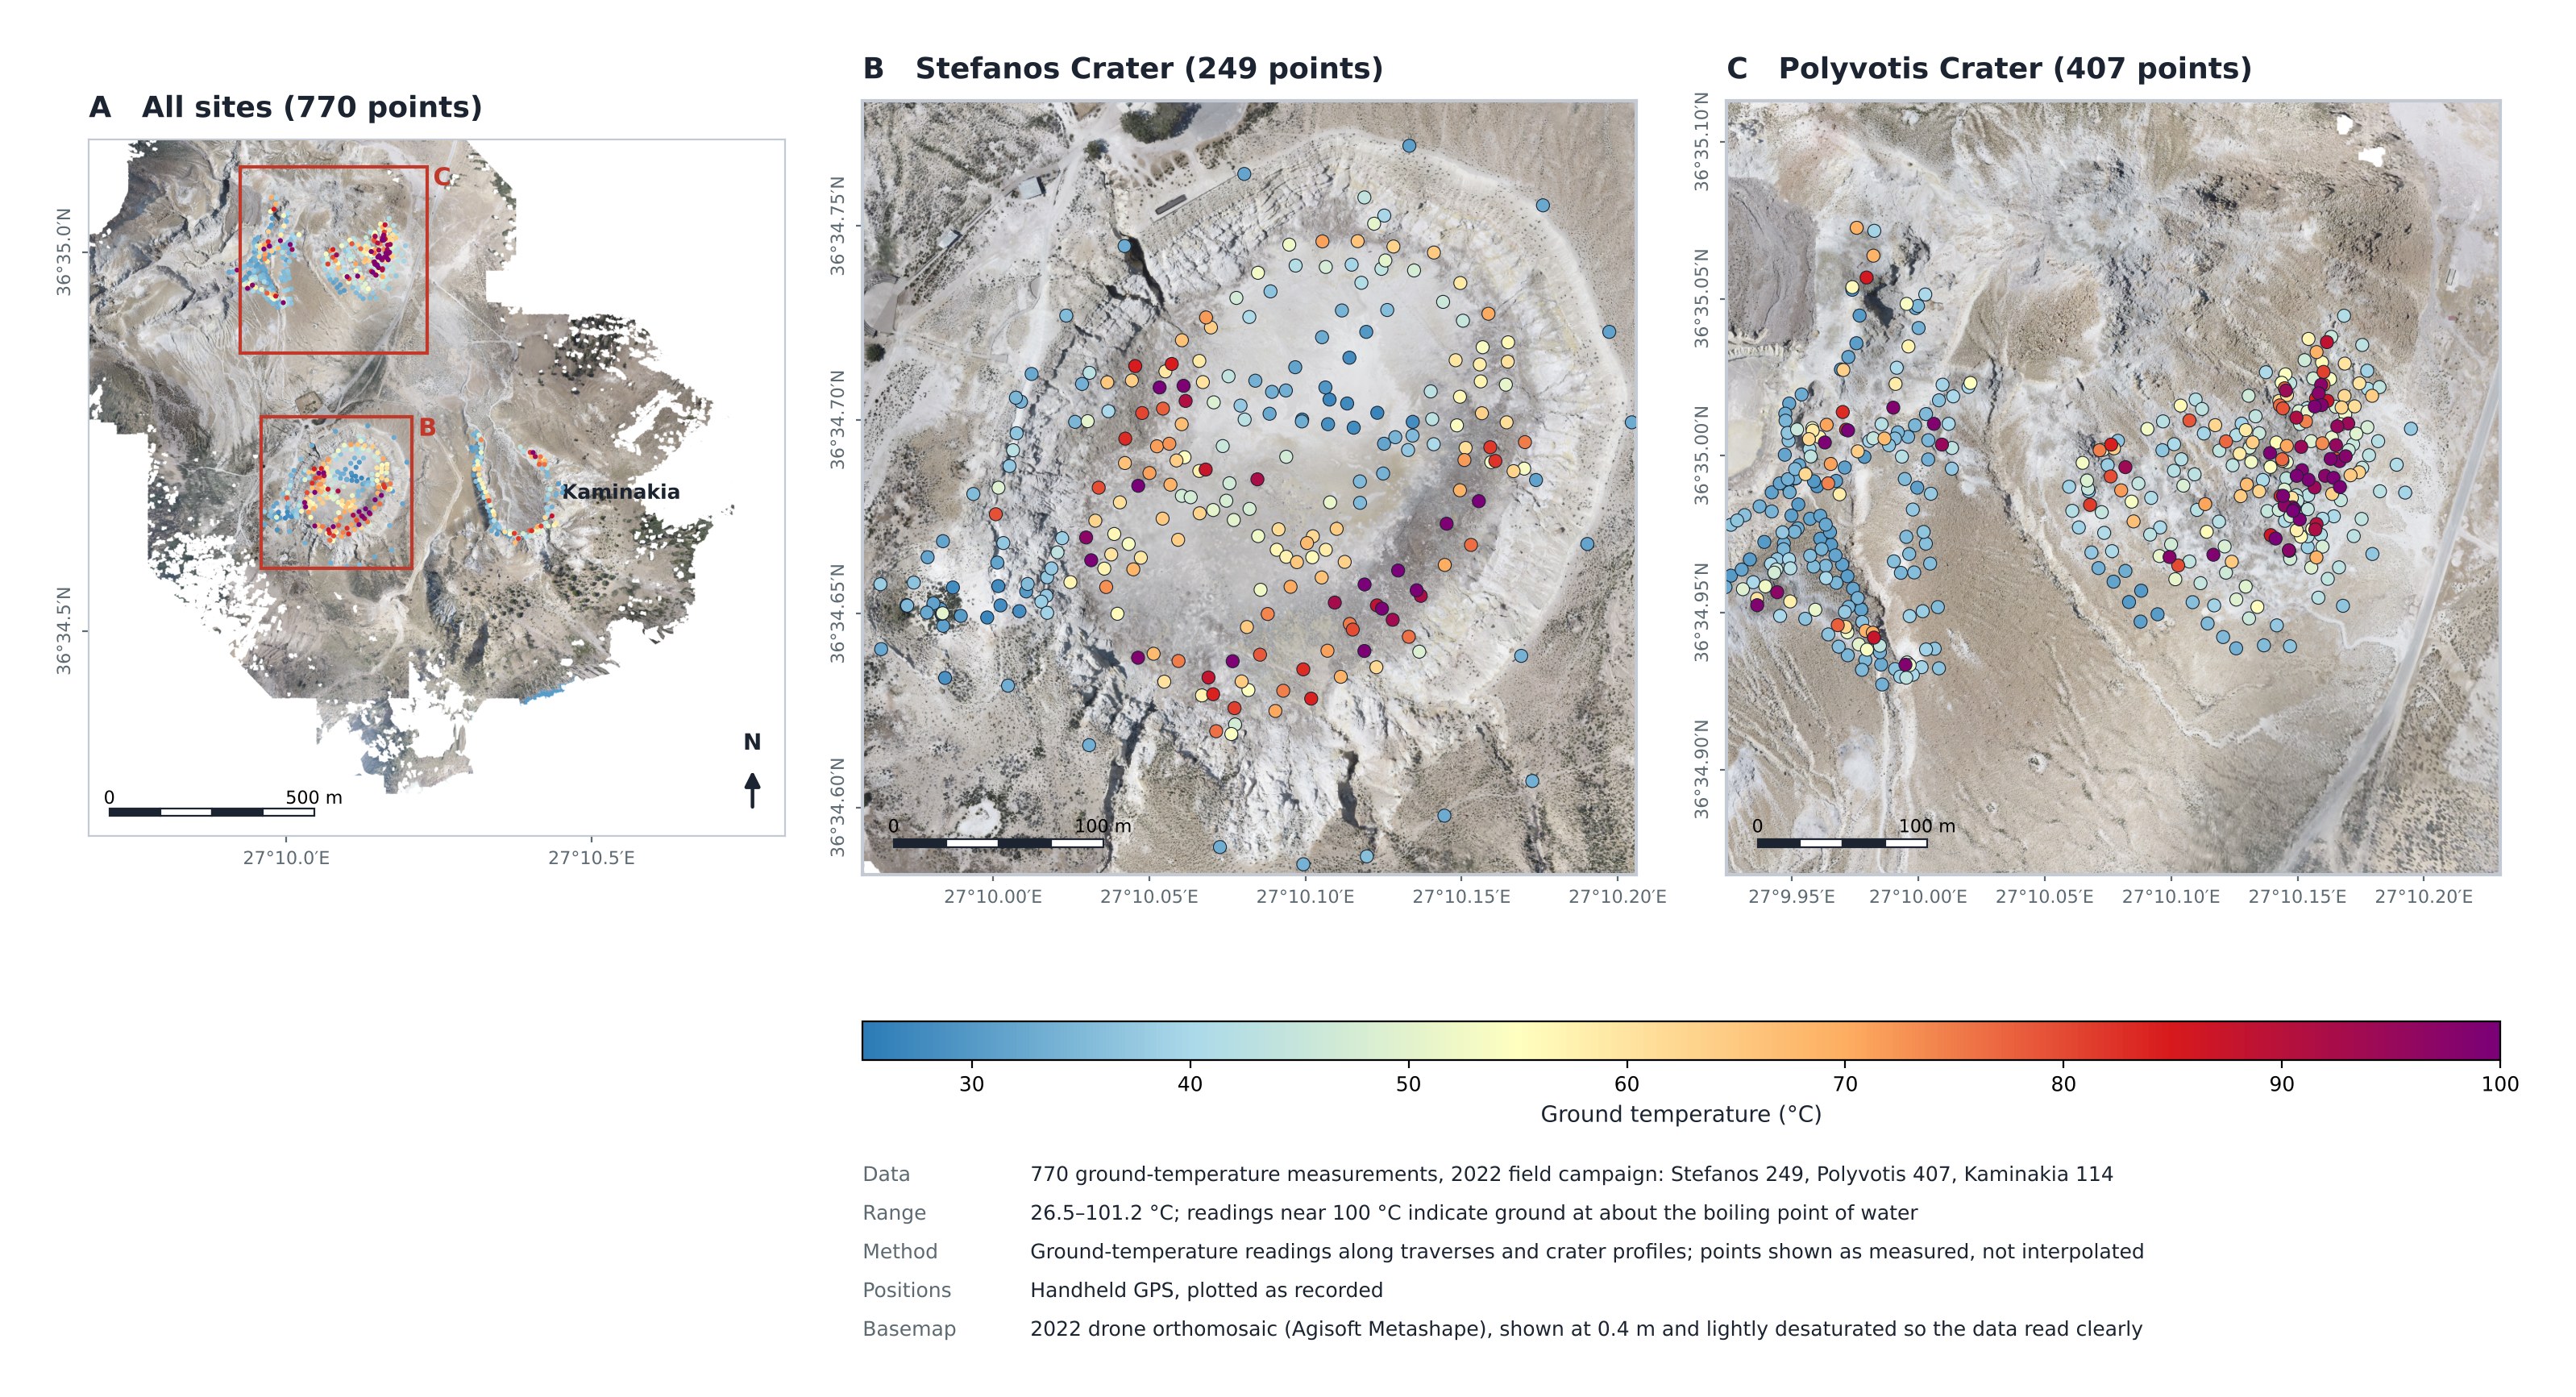
Why points, not a smooth surface: the measurements follow walking traverses with gaps between them. An interpolated heat map would invent values in those gaps, so each reading is shown where it was taken.
CO2 Gas Flux Distribution
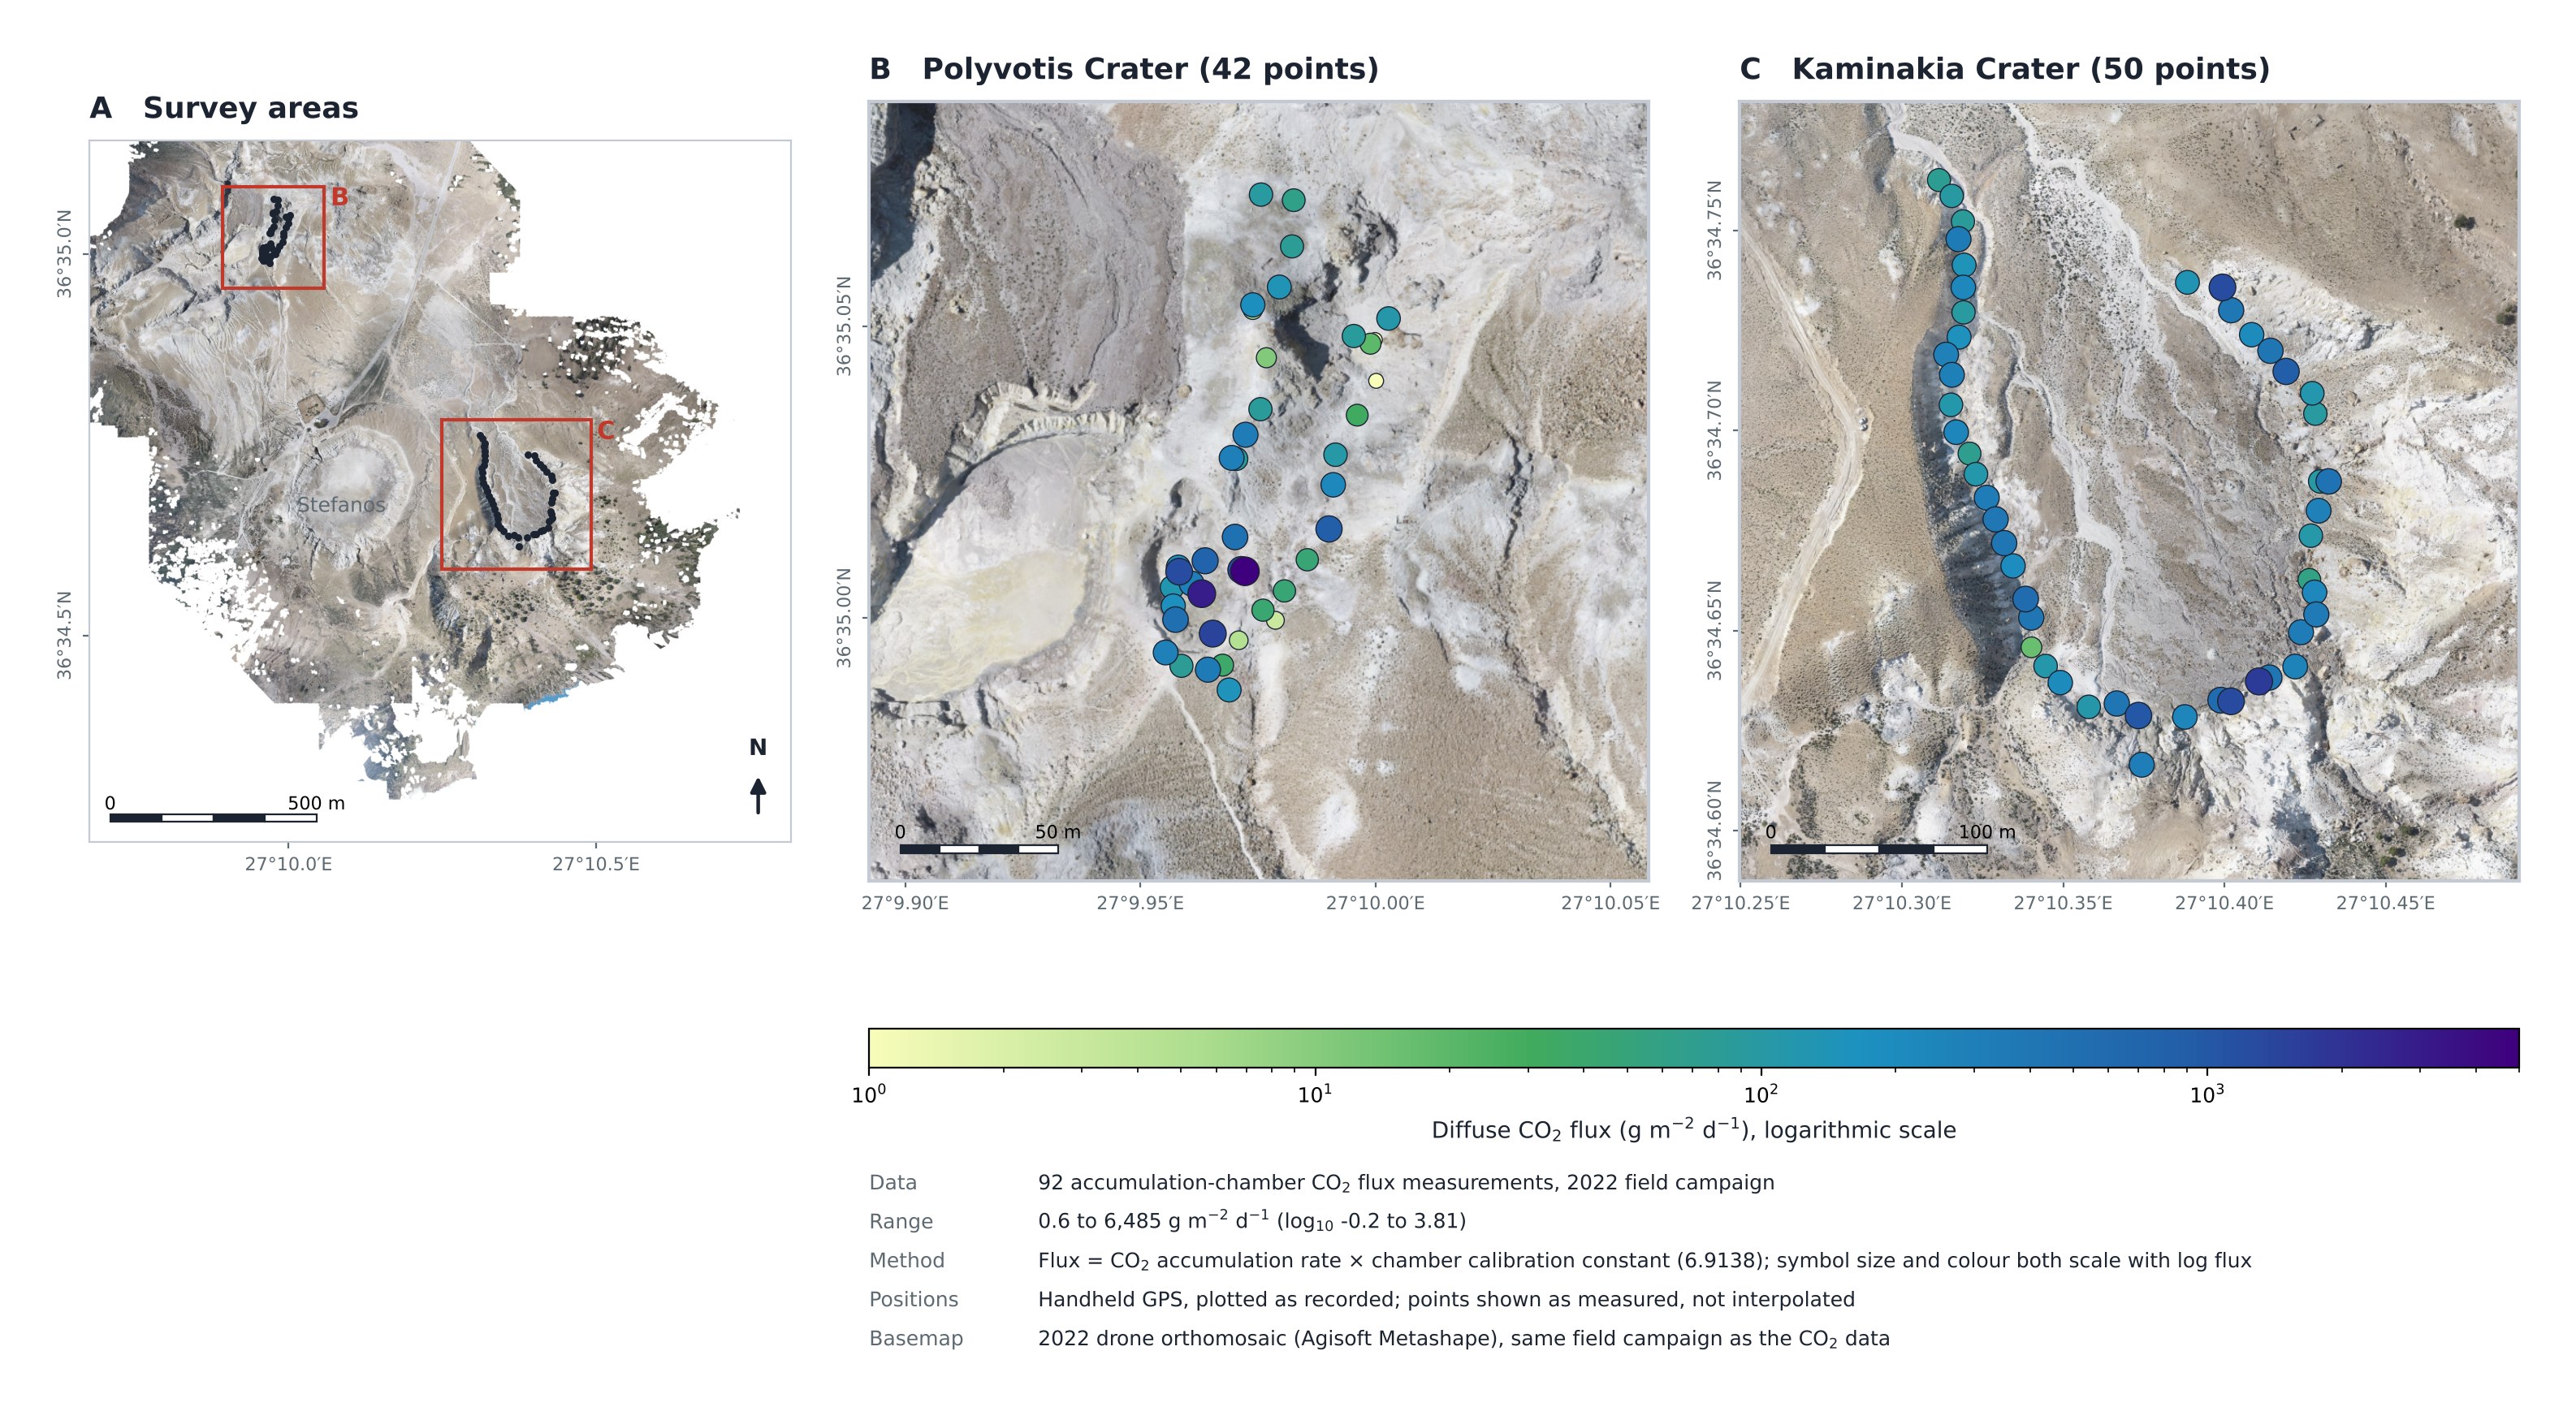
92 accumulation-chamber measurements of diffuse CO2 flux at Polyvotis and Kaminakia, on a logarithmic scale because values span four orders of magnitude. Flux correlated strongly with ground temperature at both craters (R² = 0.81 at Polyvotis, 0.95 at Kaminakia), consistent with hydrothermal fluids controlling surface heat.
Survey-to-Survey Comparison Check
Before mapping terrain change between 2022 and 2025, the two elevation models have to agree on ground that hasn't moved. I aligned them and checked the leftover difference. It was far too large to trust, and I traced the cause to processing seams in the 2025 model, so no change map is shown yet.
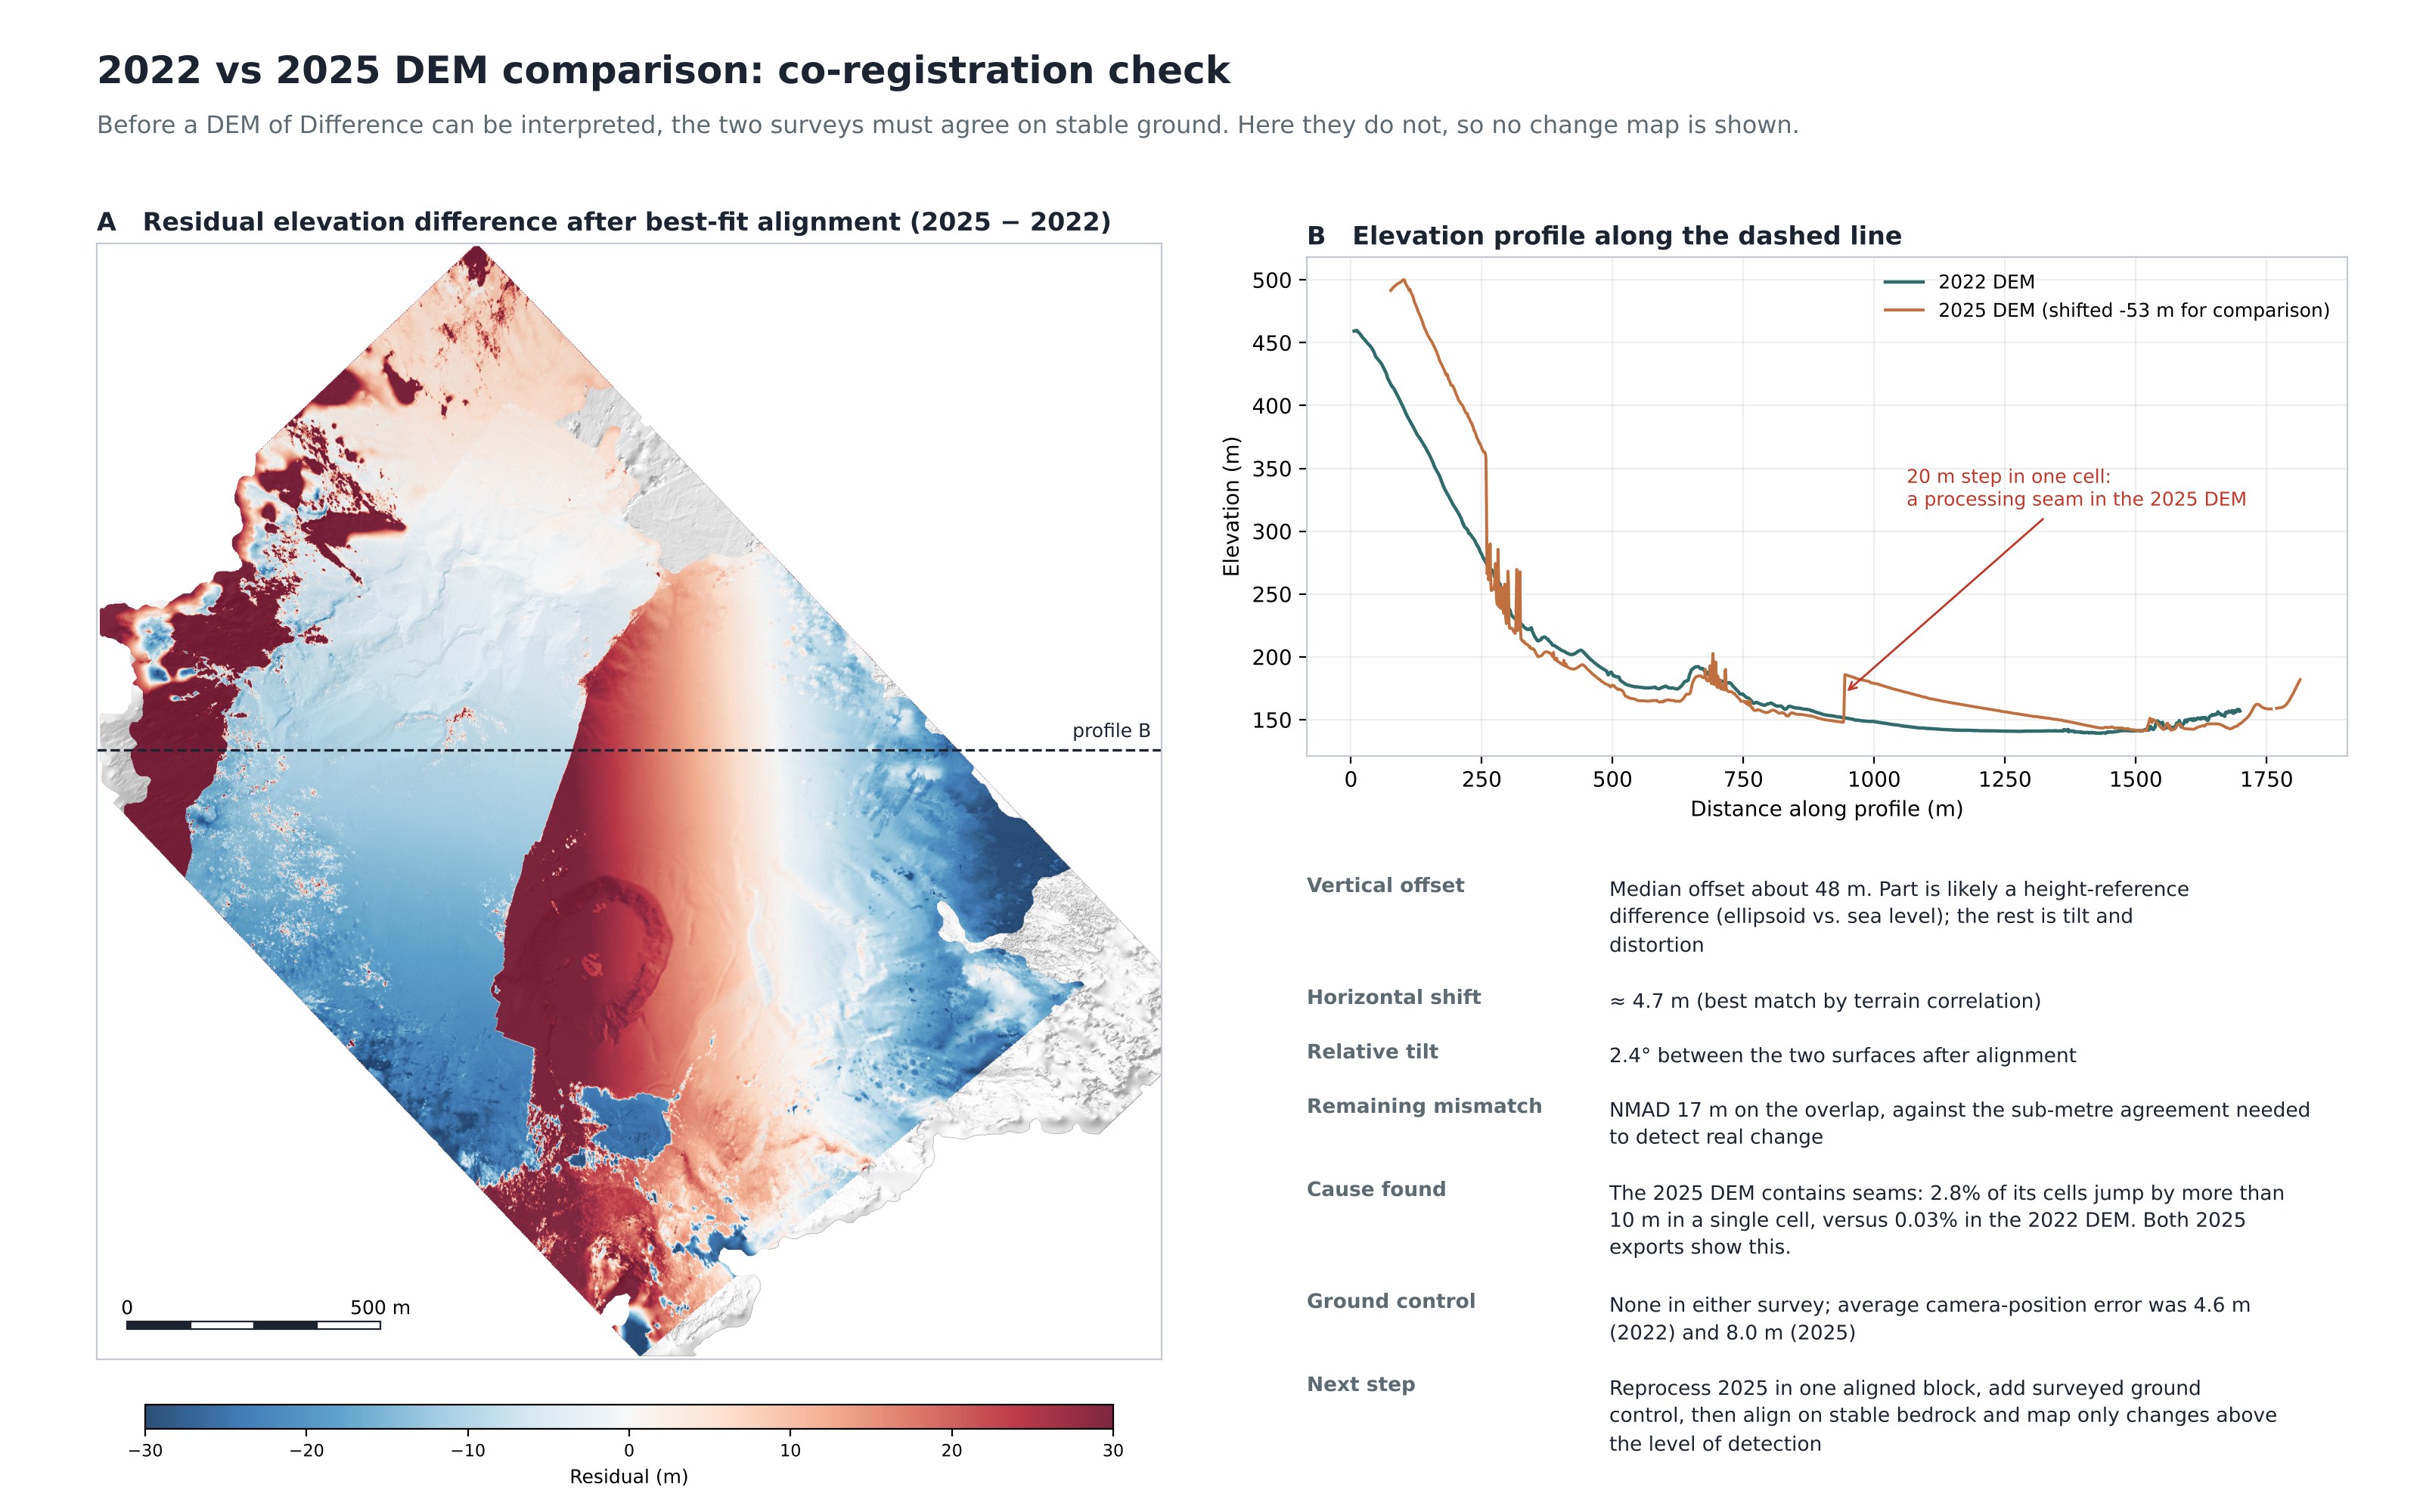
Reading it: real terrain change on a caldera floor over three years is centimetres to a few metres and patchy. A 17 m spread with a straight seam across the map points to the data, not the volcano. Catching this before publishing a change map is part of the job.
Limitations
Neither drone survey used surveyed ground control points, so positions rely on the aircraft's onboard GNSS (average camera-position error 4.6 m in 2022 and 8.0 m in 2025). Field measurements were located with handheld GPS. The 2025 elevation model contains processing seams, and parts of the 2025 field spreadsheets still need coordinate and calculation review, so the 2025 data are not used in these maps.
Next Steps
What I would do to turn the two campaigns into a measured record of change.
- 1
Reprocess the 2025 survey
Align all 2025 images in a single Metashape block to remove the seams, and put both years on the same height reference.
- 2
Add ground control
Survey permanent control points with GNSS in future campaigns so every year shares one accurate coordinate system.
- 3
Map terrain change
Align the DEMs on stable bedrock, estimate the level of detection, and map only changes larger than the survey error.
- 4
Clean the 2025 field data
Review and finalize the coordinate and flux calculations in the 2025 sheets so both years of gas and temperature data can be compared.
- 5
Model continuous surfaces
Where sampling is dense enough, interpolate temperature and CO2 with kriging and map the prediction error alongside the result.
- 6
Extend to Stefanos
Measure CO2 flux at Stefanos, the largest and hottest crater, to test the flux–temperature relationship where heat output is highest.