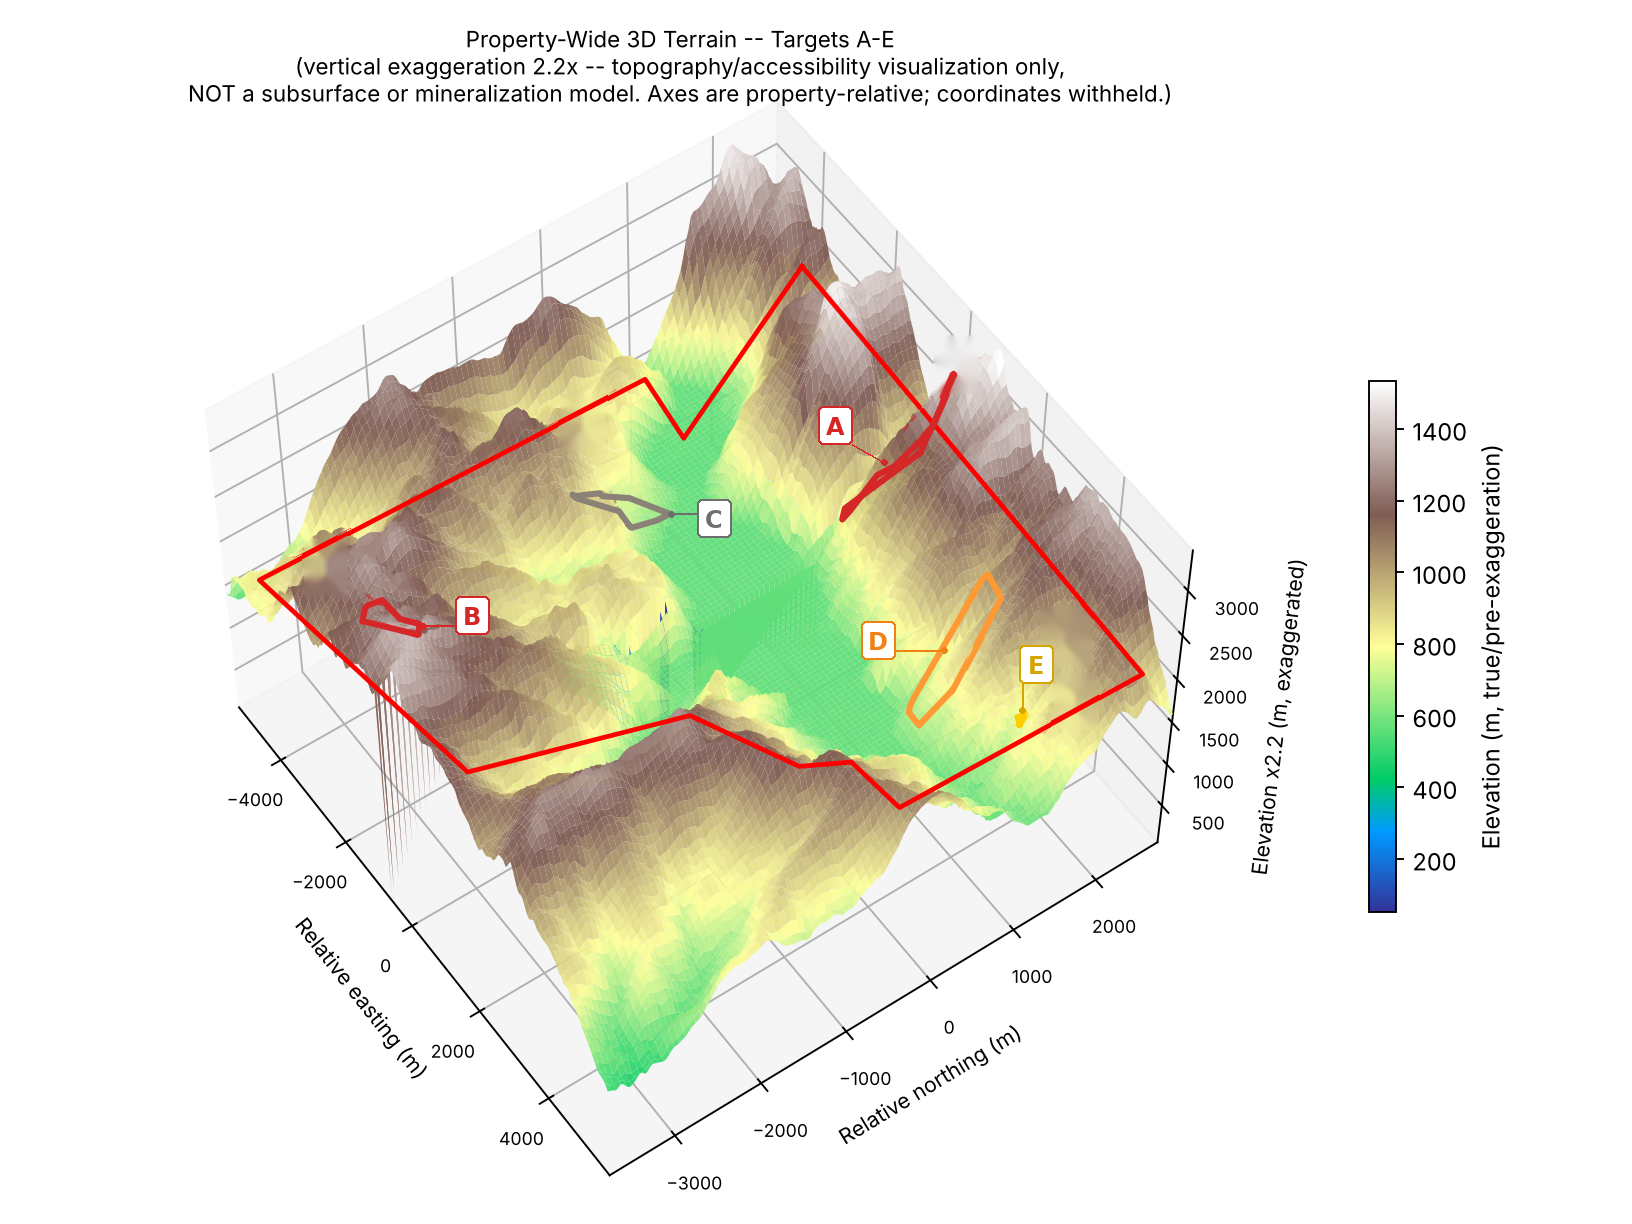
Geological & Structural Interpretation
The five target areas (A–E) shown against mapped lithological contacts and regional fault traces (CCOP-GSI 1:1,000,000 geology), on top of the clay / phyllic / propylitic alteration zones used to delineate them — the full structural and alteration context behind the ranking, not just the target outlines.
Reading it: the regional fault trace and lithological contact are preliminary, 1:1,000,000-scale CCOP-GSI data with several hundred meters to ~1 km of positional uncertainty — proximity to either is a spatial observation, not confirmation of structural control or a porphyry system. Target scores are unchanged from the audited Phase 6/7 ranking.
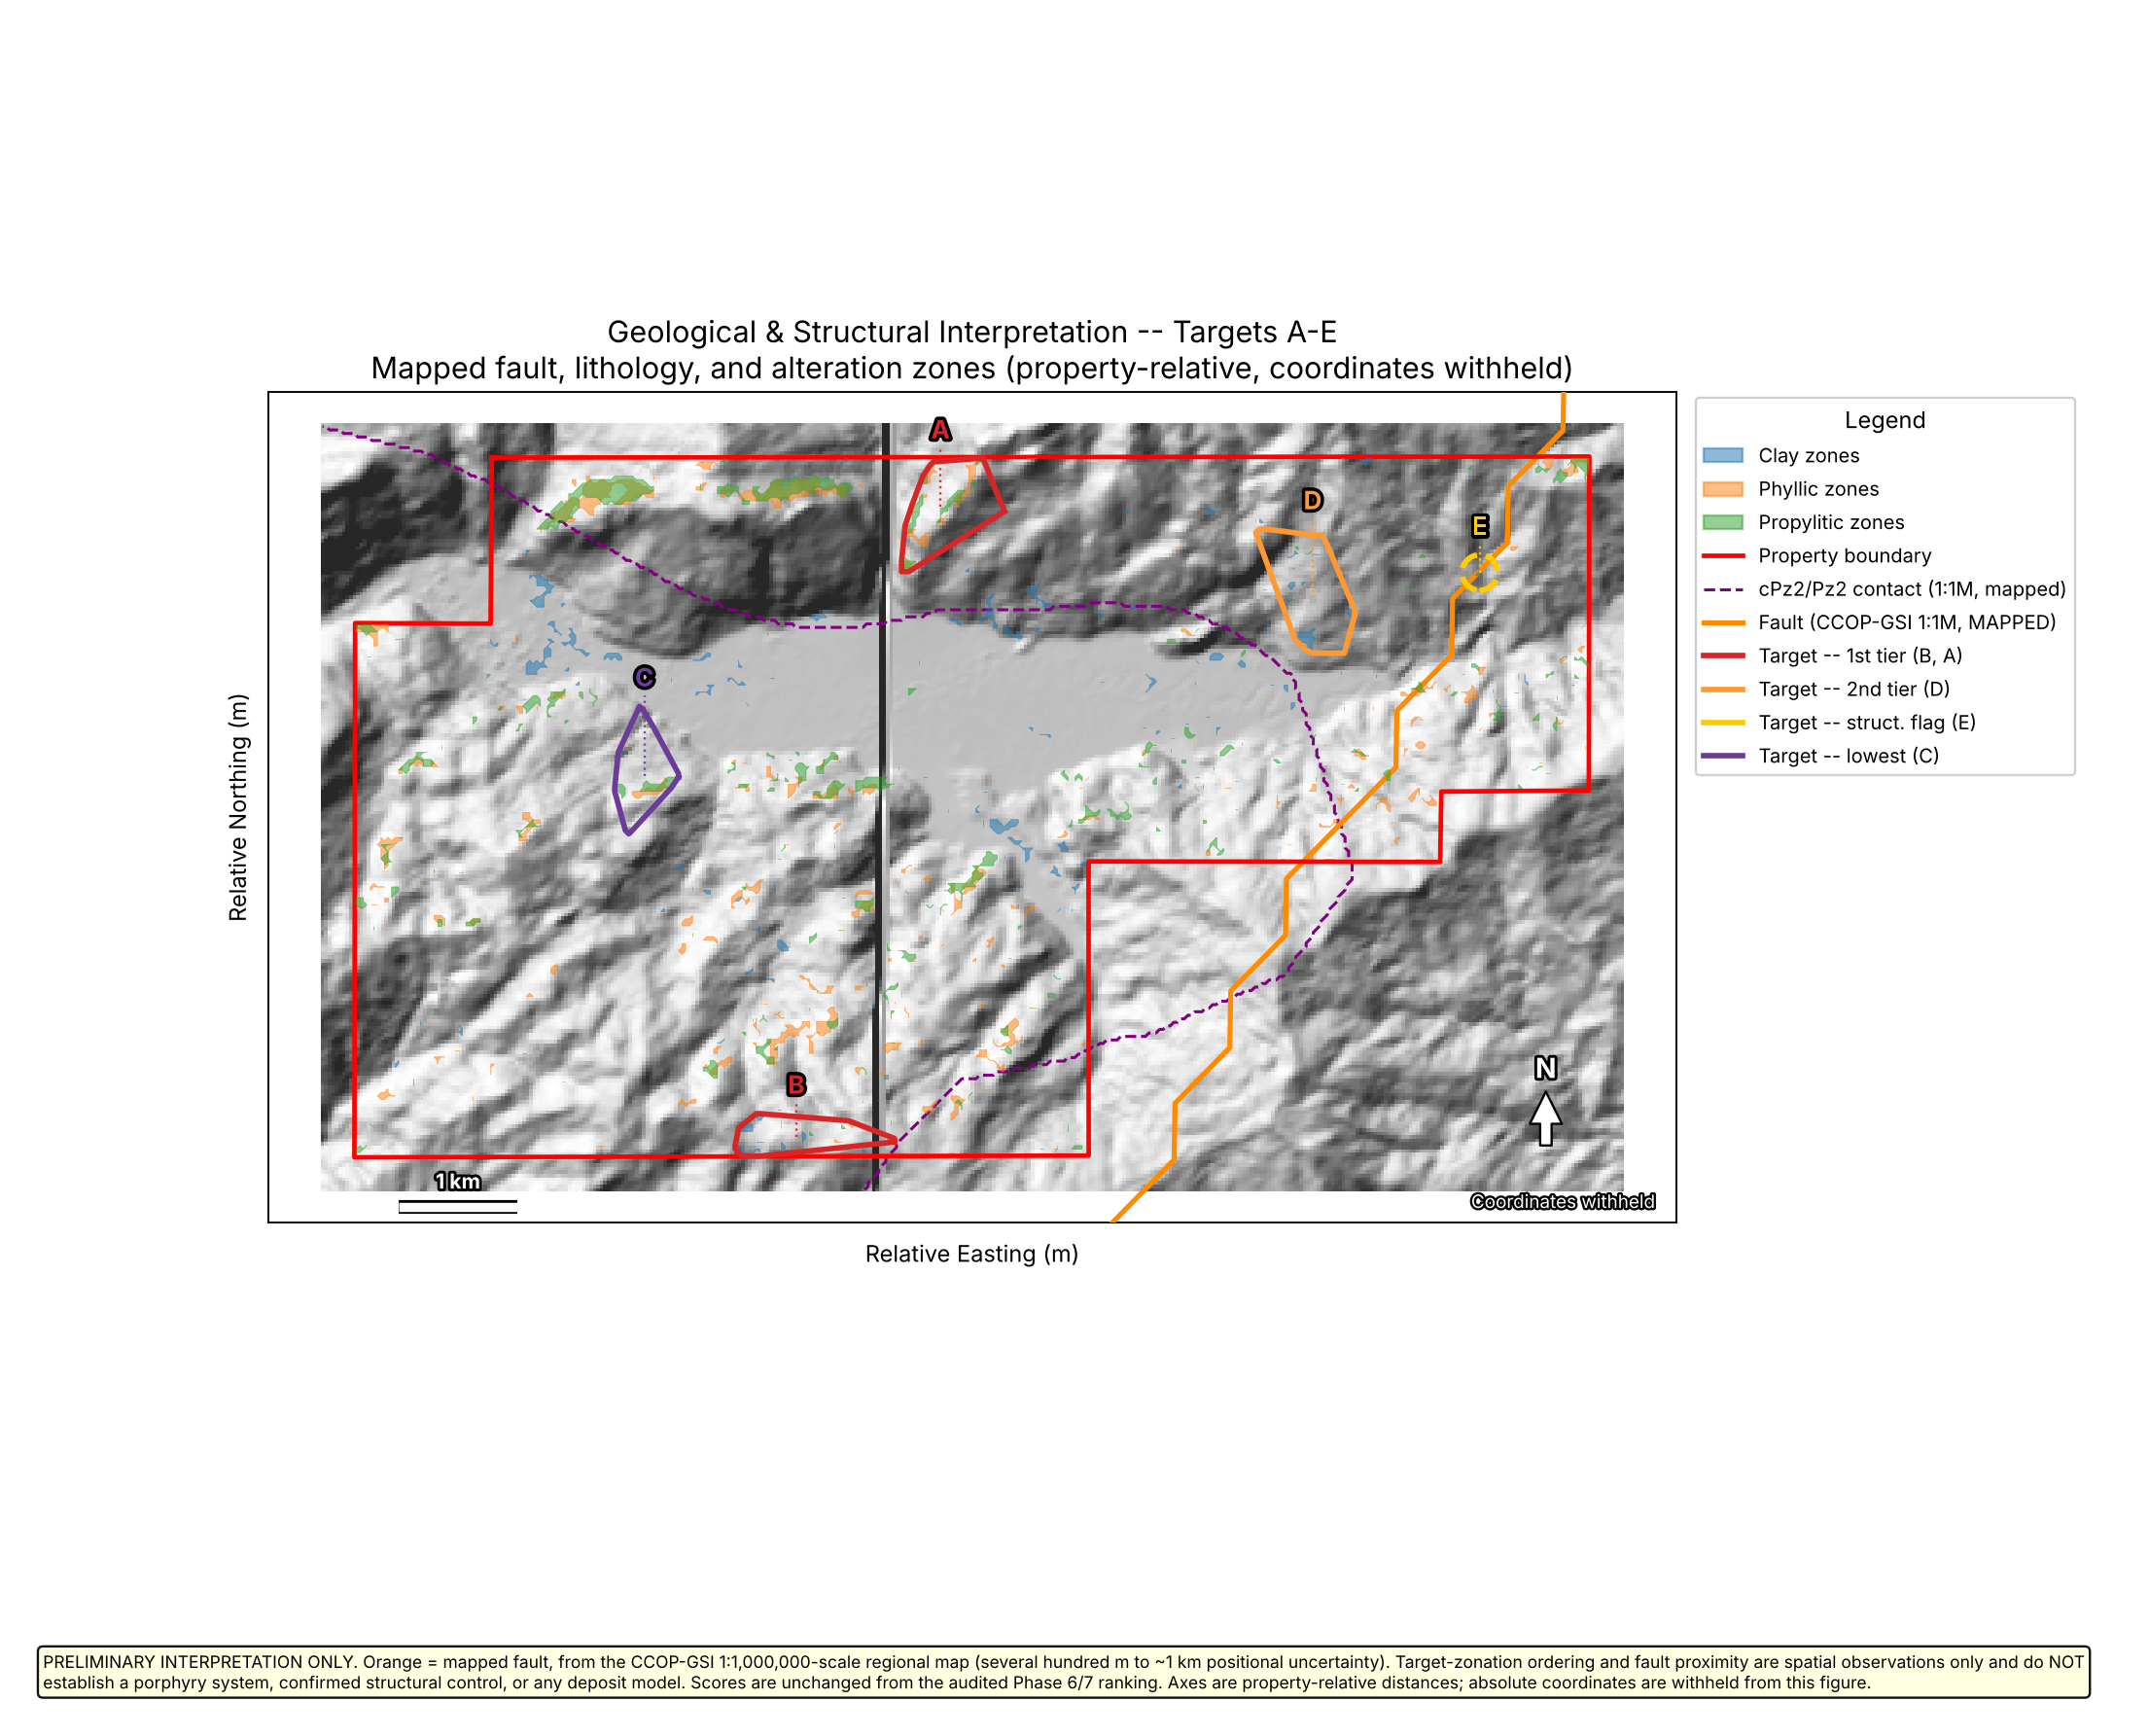
Alteration Anomaly Map
The spectral evidence behind the targets: persistent, confound-screened clay, phyllic, and propylitic anomaly pixels — the three hydrothermal alteration signatures that often ring gold systems — draped on a hillshade of the real terrain.
Reading it: dense, multi-index clusters (where two or three colors overlap) are the strongest candidates; isolated single-index pixels were screened out or down-weighted before scoring.
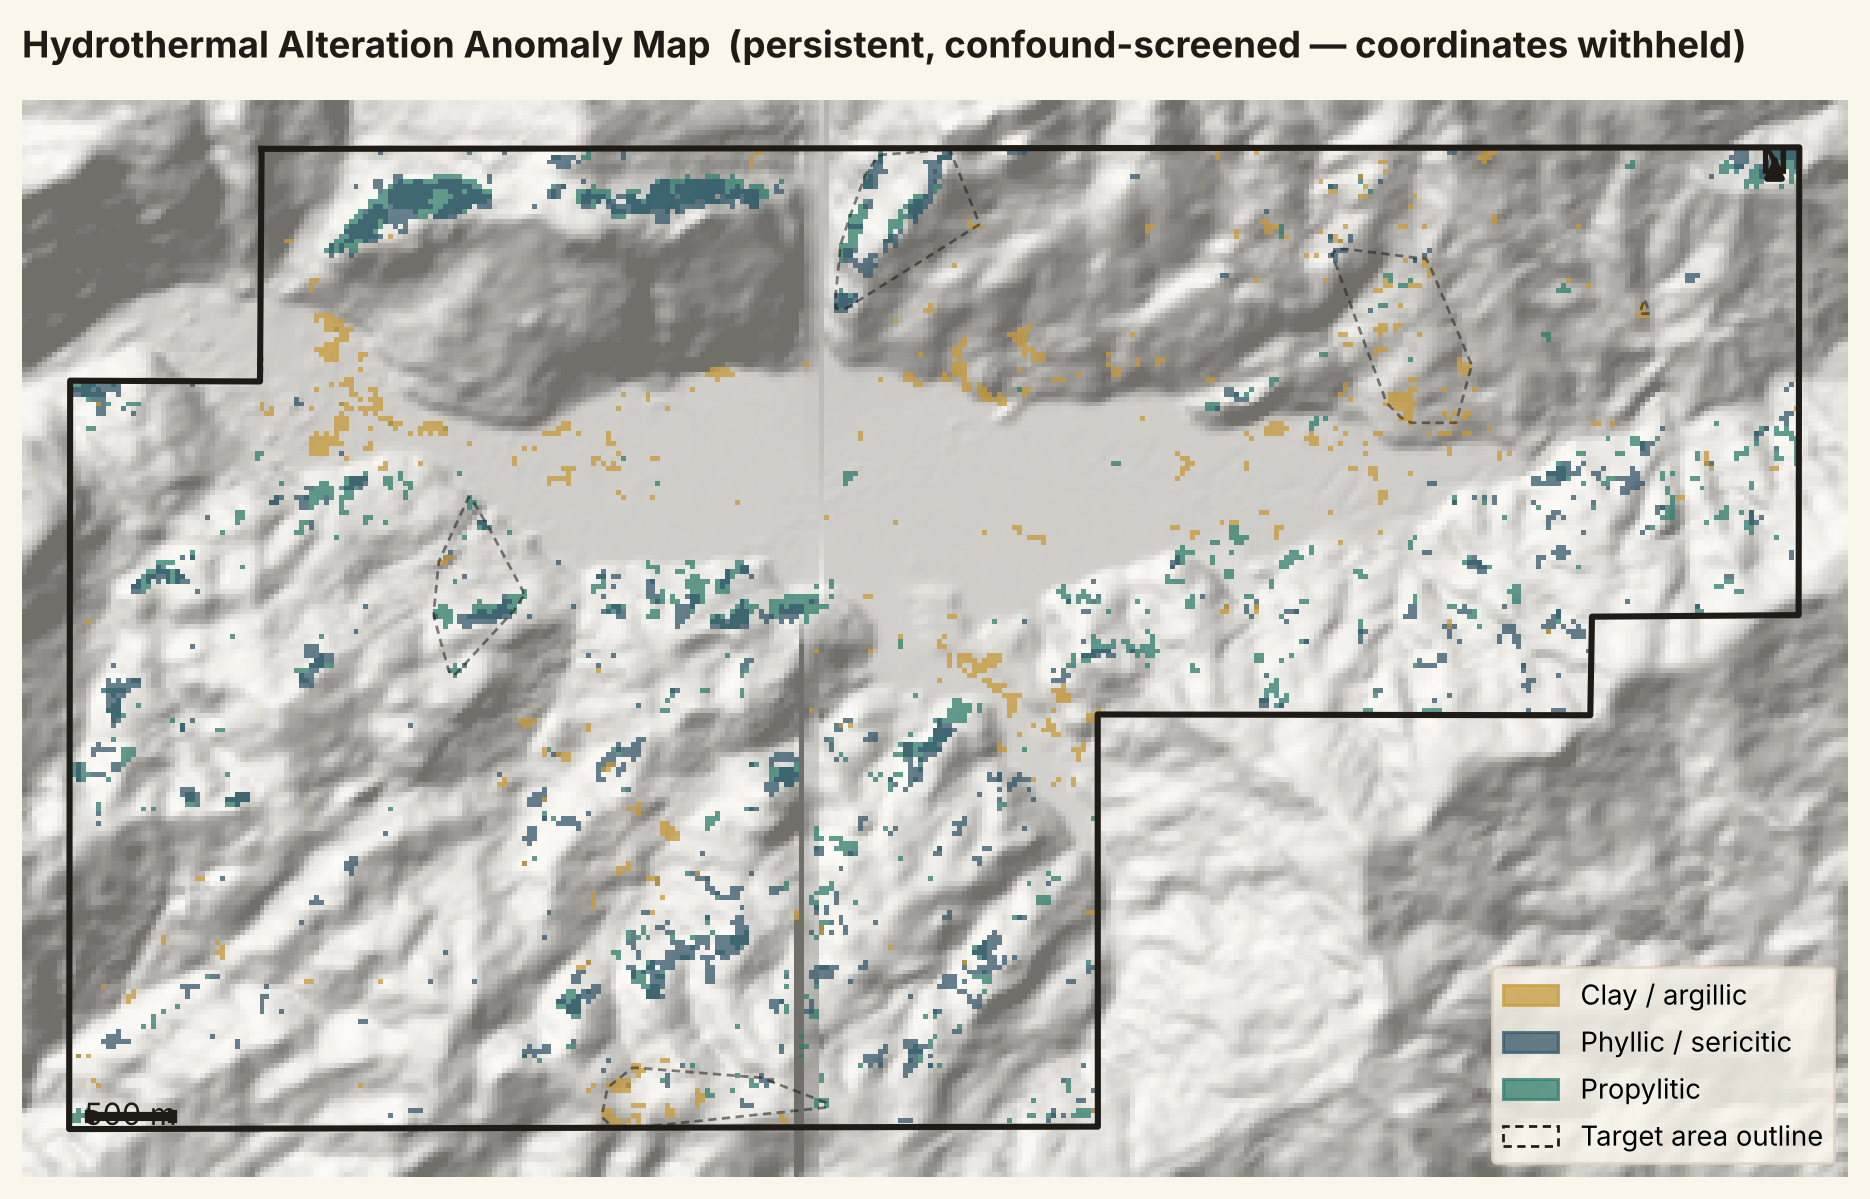
Target-Ranking Chart
How the five targets stack up on the audited, post-correction scoring framework. B and A are carried as joint first-priority — their score gap is smaller than the framework's own uncertainty, so forcing a tie-break would overstate precision the data doesn't support.
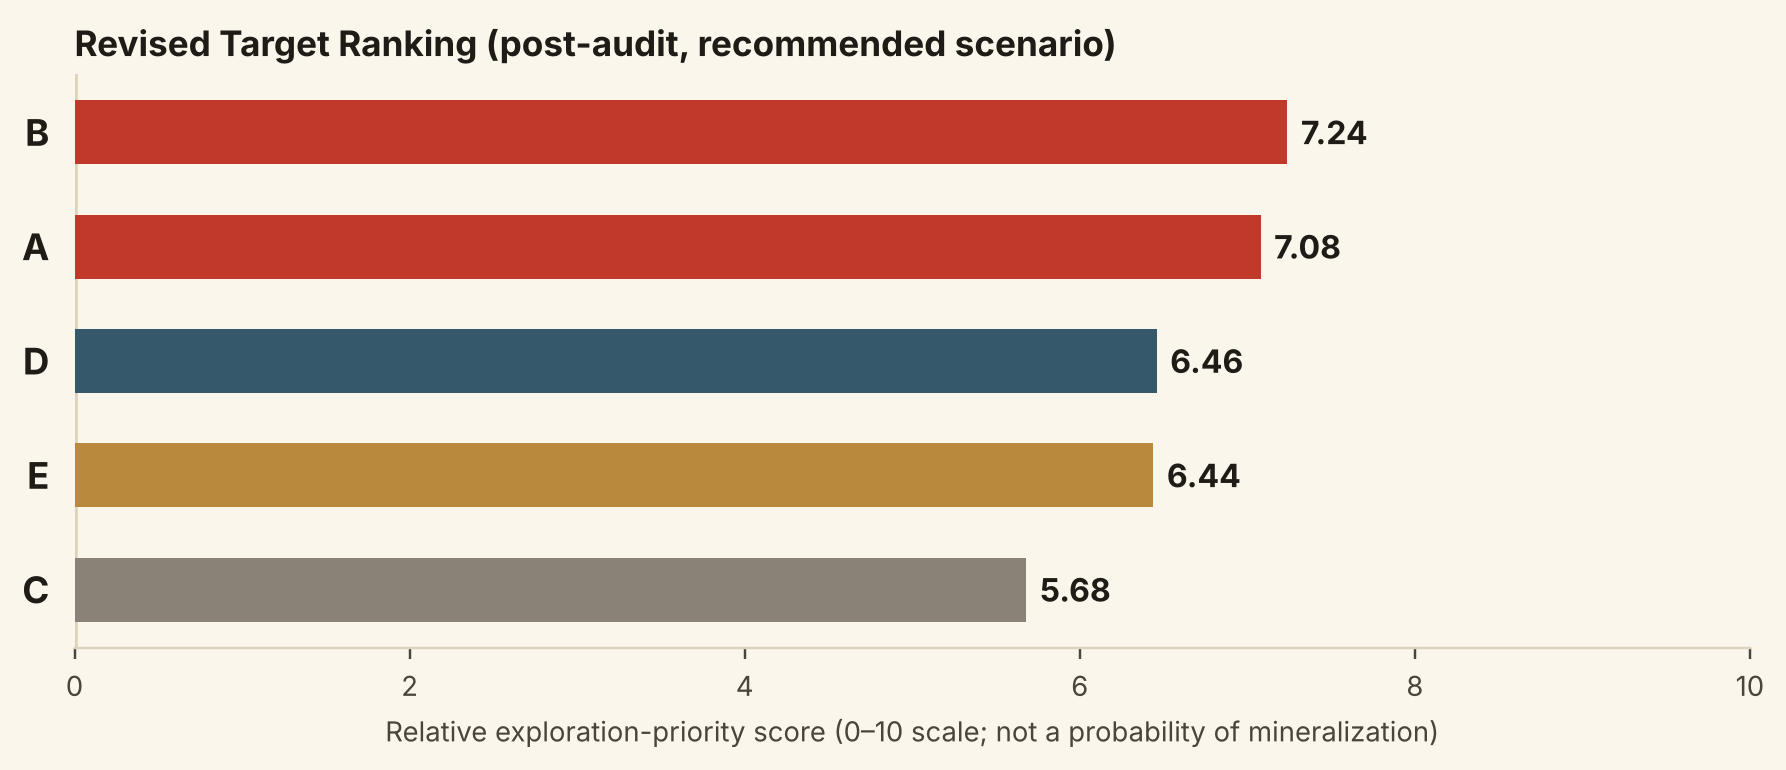
3D Terrain Visualization
Real elevation data rendered in 3D (2.2× vertical exaggeration, explicitly a topography/accessibility view — not a subsurface model) to check slope and access around each target before planning a field visit.